Channel status tab, Figure 141: solution plot, Set origin manually – NavCom StarUtil-3000 Rev.G User Manual
Page 151: Figure 142: solution plot menu, Figure

StarUtil 3000 User Guide
– Rev G
9-149
Figure
141
: Solution Plot
– Set Origin Manually
Figure
142
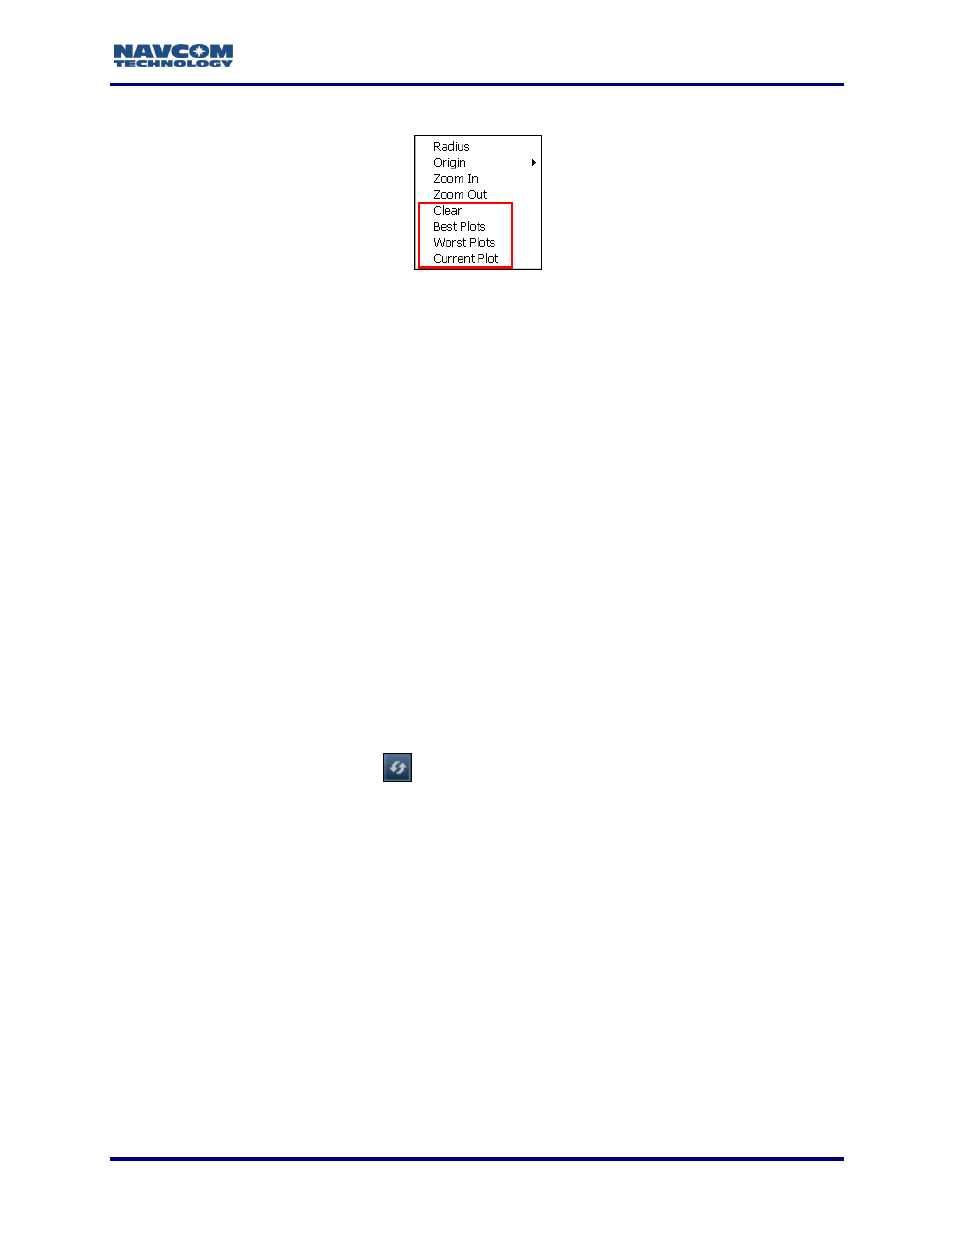
: Solution Plot Menu
Plots: The collection of data points for at least 3 hours is recommended to obtain enough
information for a useful display of the Best Plots and Worst Plots.
The Clear menu option deletes the current collection of data points. Use the menu
selections, Best Plots, Worst Plots, and Current Plot, to switch between the
different plots without clearing the collected data points.
Best Plots: The collected best points since the last Clear command
Worst Plots: The collected worst points since the last Clear command
Current Plot: The current collection of live data
Channel Status Tab
The Channel Status tab is a powerful tool that provides instantaneous diagnosis of signal quality
and performance for the tracked satellites in three constellations: GPS, GLONASS, and SBAS.
Refer to the Sapphire Technical Reference Manual for detailed information on the
[CHNLSTATUS1B] output stream (see Related Documents in the fore-matter).
Data is not displayed on this tab if [CHNLSTATUS1B] is not scheduled. If it is not
scheduled, the user may click
(refresh) on any window to poll for data. This
populates all of the Channel Status windows.
Click the Channel Status option on the Detailed Views menu to open the Channel Status tab
(see Figure 143).
