Manually creating a display – Measurement Computing WaveBook rev.3.0 User Manual
Page 126
6-12 PostView
WaveBook User’s Manual
Units/Div. When Units/Div. is selected you can alter Y Center and Units/Div. Y Center is the centerline
value of the chart when the channel is selected. Units/Div. is the vertical value of on chart grid increment.
When you change Y Center or Units/Div. Y Max and Y Min are automatically adjusted. You can not
directly adjust Y Max or Y Min while “Units/Div.” Is selected. You can change Y Center and Units/Div. by
using the up and down arrows, or by highlighting the existing value, typing in the new value, the pressing
“Enter” on your PC keyboard.
Note:
If the window size is changed, a chart operating in the Units/Div. Mode will maintain its units per
division scale setting across the chart.
Manually Creating a Display
Note:
This method of creating a display can only be accessed from the Chart Setup Wizard. It cannot be
accessed if PostView is using an existing display configuration file.
Unlike editing a display, as just described, this method involves creating a display from scratch. If you plan
to have a chart setup which is not weighted evenly, i.e., different numbers of channels per chart and
different numbers of charts per group, you may want to manually create your chart display in this manner.
This method can only be arrived at from the Chart Setup Wizard by selecting Manual Chart Creation,
Create Charts. This bypasses the Chart Setup Wizard and enters the manual editing mode, discussed.
Although this method is referred to as “manual,” it still contains automatic elements, such as Automatically
Add Groups to the Setup.
Perform the following steps to manually create your chart display.
1. From the Chart Setup Wizard window, select Manual Chart Creation, Create Charts. This bypasses
the Chart Setup Wizard and enters the manual editing mode.
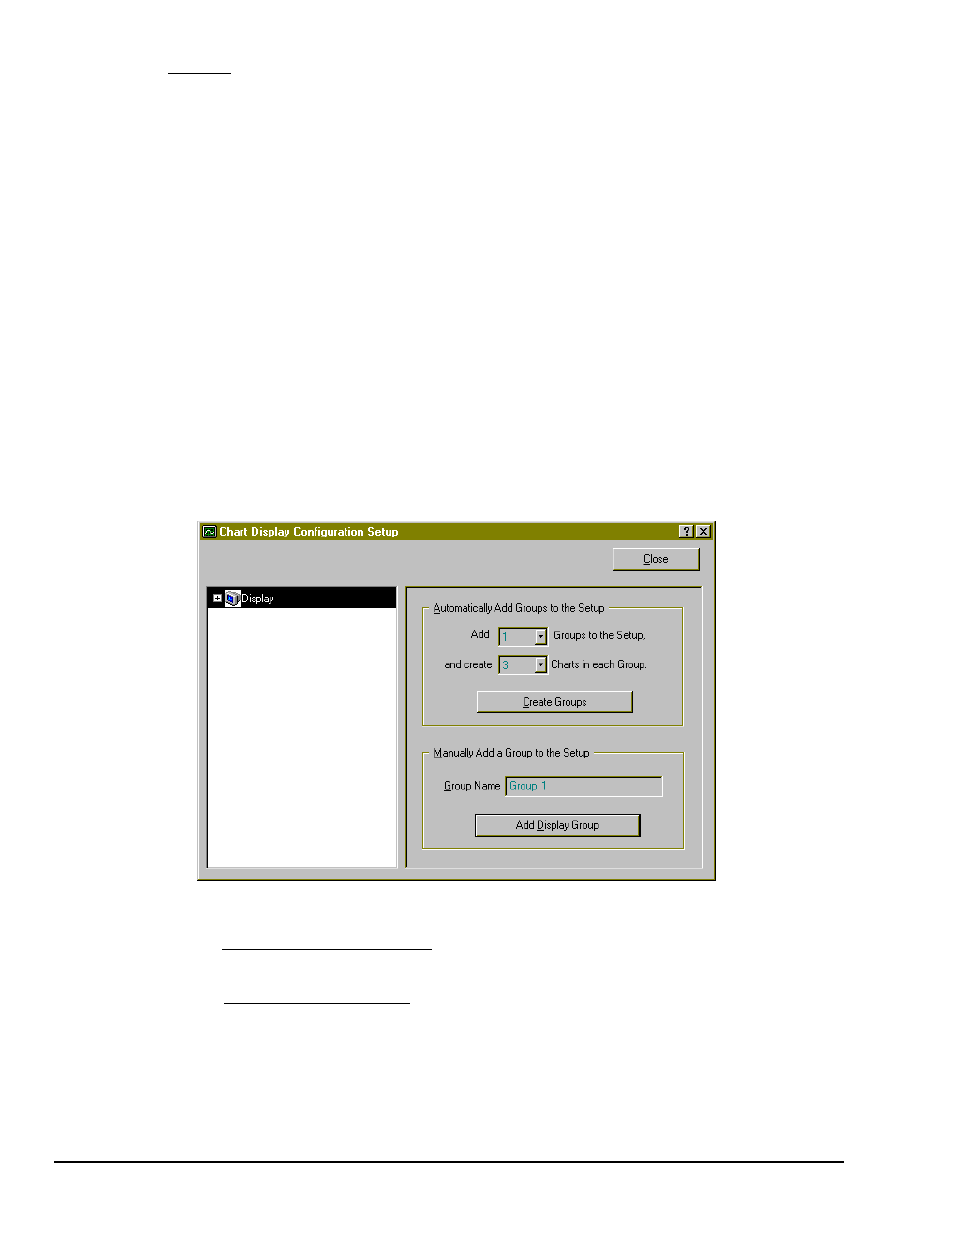
Display Configuration Setup, Initial Screen During Manual Creation
2. Perform (2a) or (2b) as appropriate to your application.
(2a) Automatically add groups to the setup. Enter the number of groups and charts desired by using the cursor and
typing in the value, or by using the pull-down arrows (
τ) and making the appropriate selections; then click on the
Create Groups button.
(2b) Manually add groups to the setup. Type in the name of the chart group; then click on the Add Display Group
button.
The Display Configuration Setup screen changes to show chart groups, and the number of charts for the
selected (black highlighted) chart group (see following figure). From this screen you can change the
number of charts in a group, as well as change the group name.