Automatic display creation, Eation ……6-9 – Measurement Computing WaveBook rev.3.0 User Manual
Page 123
WaveBook User’s Manual,
5-20-99
PostView 6-9
Automatic Display Creation
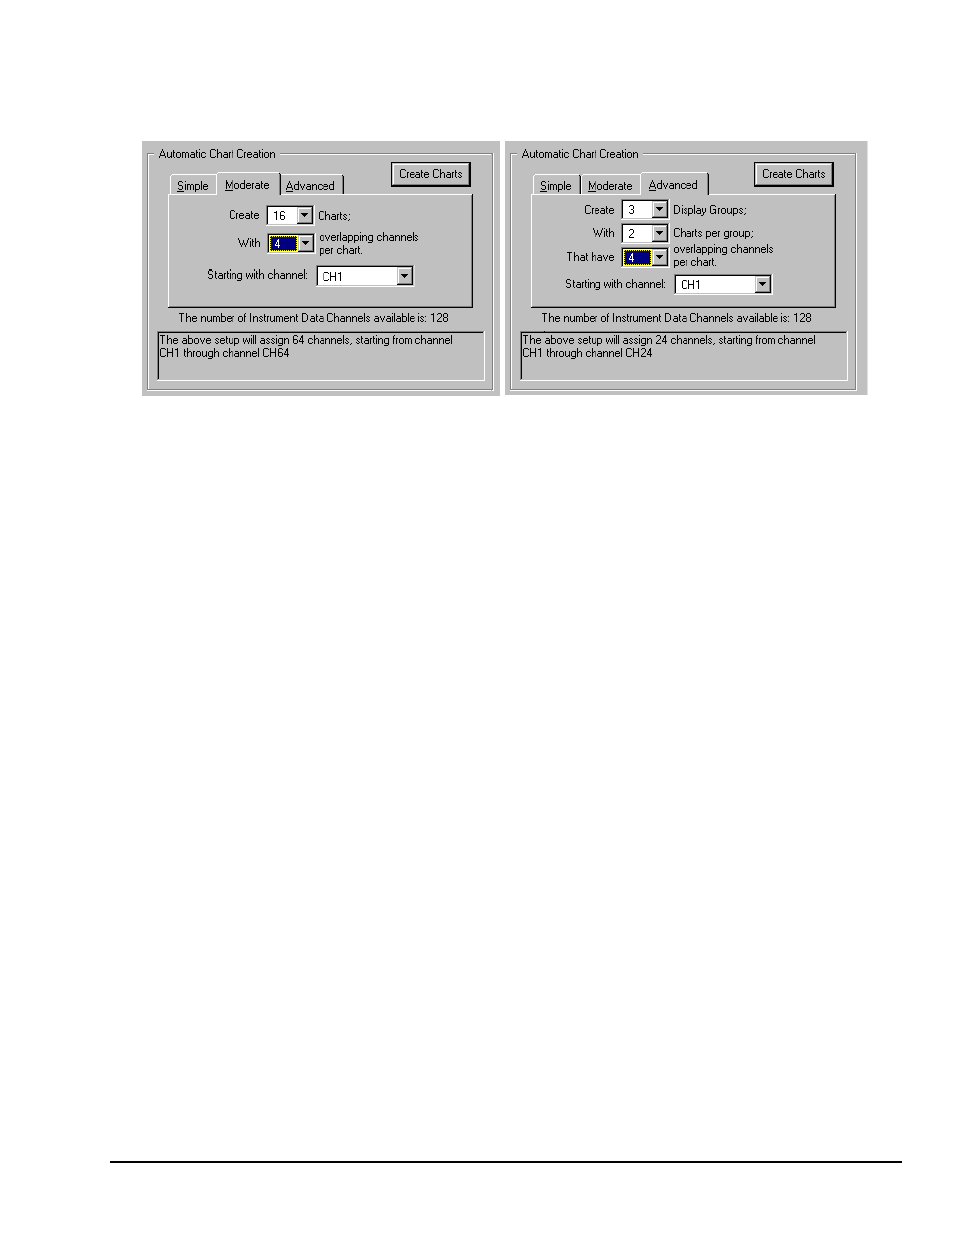
The previous figure shows the Simple mode dialog box for Automatic Chart Creation. The following
figures show the Moderate and Advanced mode dialog boxes.
Dialog Boxes for Moderate and Advanced Modes of Automatic Chart Creation
It is a simple task to create a chart display configuration using the automatic method. The following steps
apply to this feature of Chart Setup Wizard.
Note:
If PostView locates a display configuration file, Chart Setup Wizard will not be activated unless
you choose to manually activate the Wizard from the File pull-down menu.
1. From the Chart Setup Wizard window, select the desired mode (Simple, Moderate, or Advanced).
Note:
Selecting Manual Chart Creation, Create Charts bypasses the Chart Setup Wizard and enters a
manual editing mode. This option makes use of PostView’s Display Configuration feature
discussed in the following section, Display Configuration.
2. Use the pull-down arrows (
τ
), or use the cursor and type in a new value to make selections for the
number of groups, charts, and channels as applicable.
3. If you desire to start with a channel other than channel 1, use the pull-down arrow and select the desired
starting channel number.
4. When your setup is complete, click on the Create Charts button. A percentage of completion bar will
appear, followed by the PostView window.
The channels in the setup you create will appear in chart form on PostView’s window. The Channels will
overlap on their assigned Chart (for configurations making use of multiple channels per chart), and will be
visible when the applicable Group is selected. Note that only one group of charts can be viewed at a time.