Menu items & toolbar buttons, File, Acquire – Measurement Computing WaveBook rev.3.0 User Manual
Page 110: Charts, Options, Window, Harts…… 5-16, Tions…… 5-16
5-16 WaveView,
6-24-99
WaveBook User’s Manual
Menu Items & Toolbar Buttons
You can control the acquisition process and the Scope display from the menu selections and toolbar
buttons. There are more pull-down menu selections available than there are buttons; however, each button
does have a corresponding menu item.
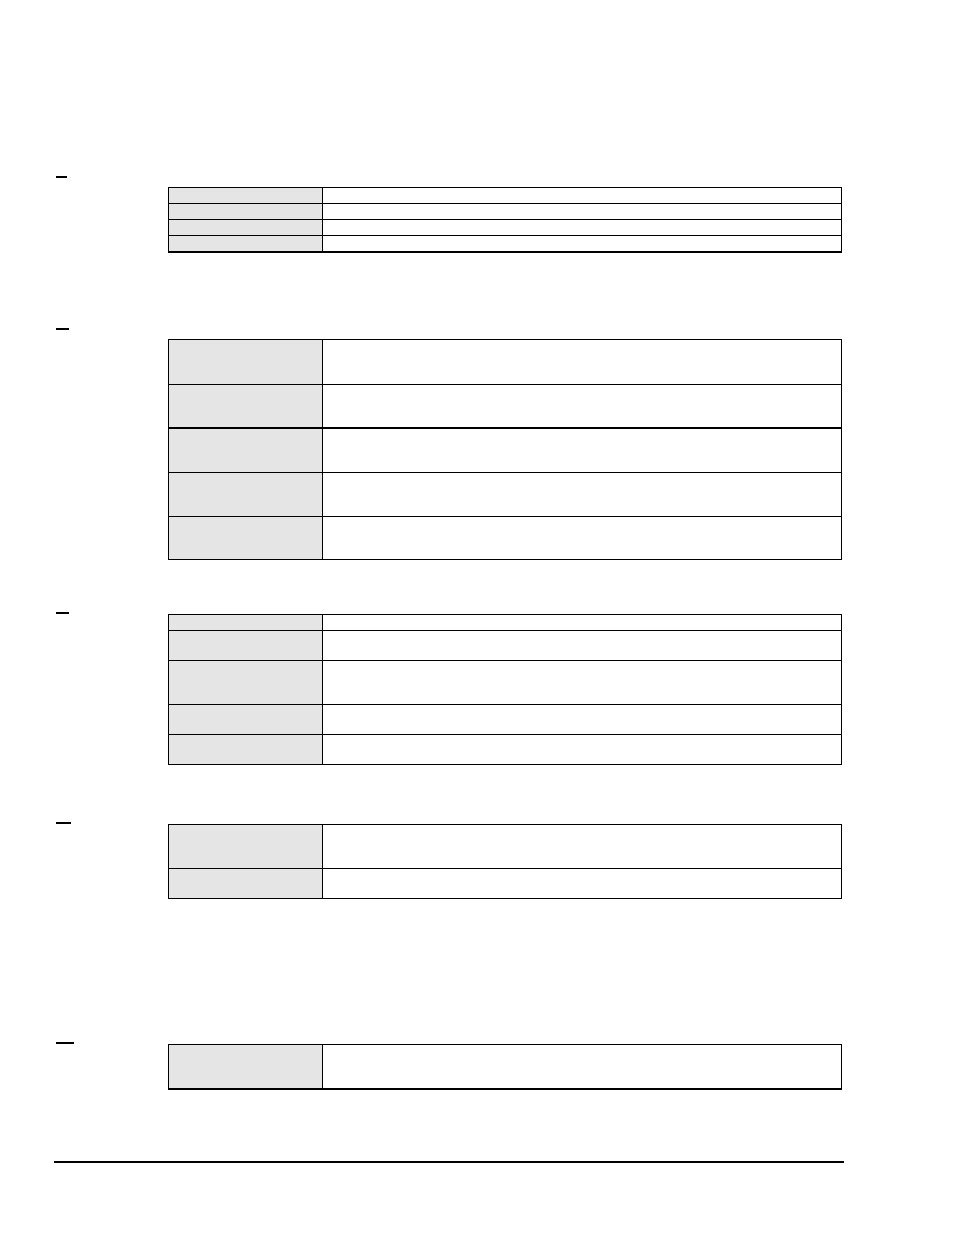
File
Save Data Files
Saves data in pre-selected formats. Same as the Save Data File button.
Save Data File As
Selects data format for saved files: raw binary, PostView binary, text/spreadsheet, etc.
Print Window
Prints the contents of the scope display.
Close Scope
Closes the Scope display and returns to the configuration menu.
Acquire
Acquire Continuously
Sets WaveView to a looping mode. As soon as an acquisition has completed, it is re-
armed and the acquisition repeats. Requires the Stop or Abort button to stop. Same as
function as the Acquire Continuously button.
Acquire One Shot
The acquisition starts as soon as the trigger event is satisfied. Same as the Acquire One-
Shot button.
Stop After Acquisition
Complete
Stops the data acquisition when continuous mode has been selected. The scan will finish
taking the last set of samples before stopping. Same as the Stop After Acquisition
Complete button.
Stop Immediately
Stops the data acquisition immediately without waiting for the last acquisition to finish.
Same function as the Stop Immediately button.
Manual Trigger
Acquisition starts when the manual trigger is selected if in Continuous or One-Shot Mode.
Same as Manual Trigger button.
Charts
Number of Charts
Sets the number of charts (maximum of 8) to be displayed simultaneously.
Zoom In
Halves the visible timebase. Example: if 10 ms of information is visible, clicking Zoom In
will show 5 ms. Same as the Zoom In button. Maximum Zoom In is 2 samples.
Zoom Out
Doubles the visible timebase. Example: if 10 seconds of information is visible, clicking
Zoom Out will show 20 seconds. Same as the Zoom Out button. Maximum Zoom Out is
2000 samples.
Enable AutoScaling
Continuously adjusts the Y-axis for all channels so that the visible waveform fills 90% of
the graph’s range.
Scale All Charts
Adjusts the Y axis for all channels so that the visible waveform fills 90% of the graph’s
range. Same as the Scale All Charts button.
Options
Display Cross Hairs
A cross hair is a marker that shows the numerical values of time and magnitude at its
present location in the waveform. Same as Display Cross Hairs button. Toggle button to
turn cross hairs on or off.
Display Grids
Displays a grid for each chart. Same as Display Grids button. Toggle button to turn grids
on or off.
Individual cross-hairs can be moved by holding down the left mouse button and dragging the selected cross-
hair to the new location on the chart. Holding the right mouse button and dragging, moves all the cross-hairs
simultaneously to a new location. The voltage and time display at the side changes as you do this.
Cross-hairs are disabled during an acquisition.
Window
Go To Configuration
Window
Returns to the configuration menu. Unlike the Close Scope function from the File menu,
this option does not close the Scope display. You can toggle back and forth between
windows by clicking the mouse on the desired window.