Menu items, File, Chart – Measurement Computing WaveBook rev.3.0 User Manual
Page 120: Go to, Options
6-6 PostView
WaveBook User’s Manual
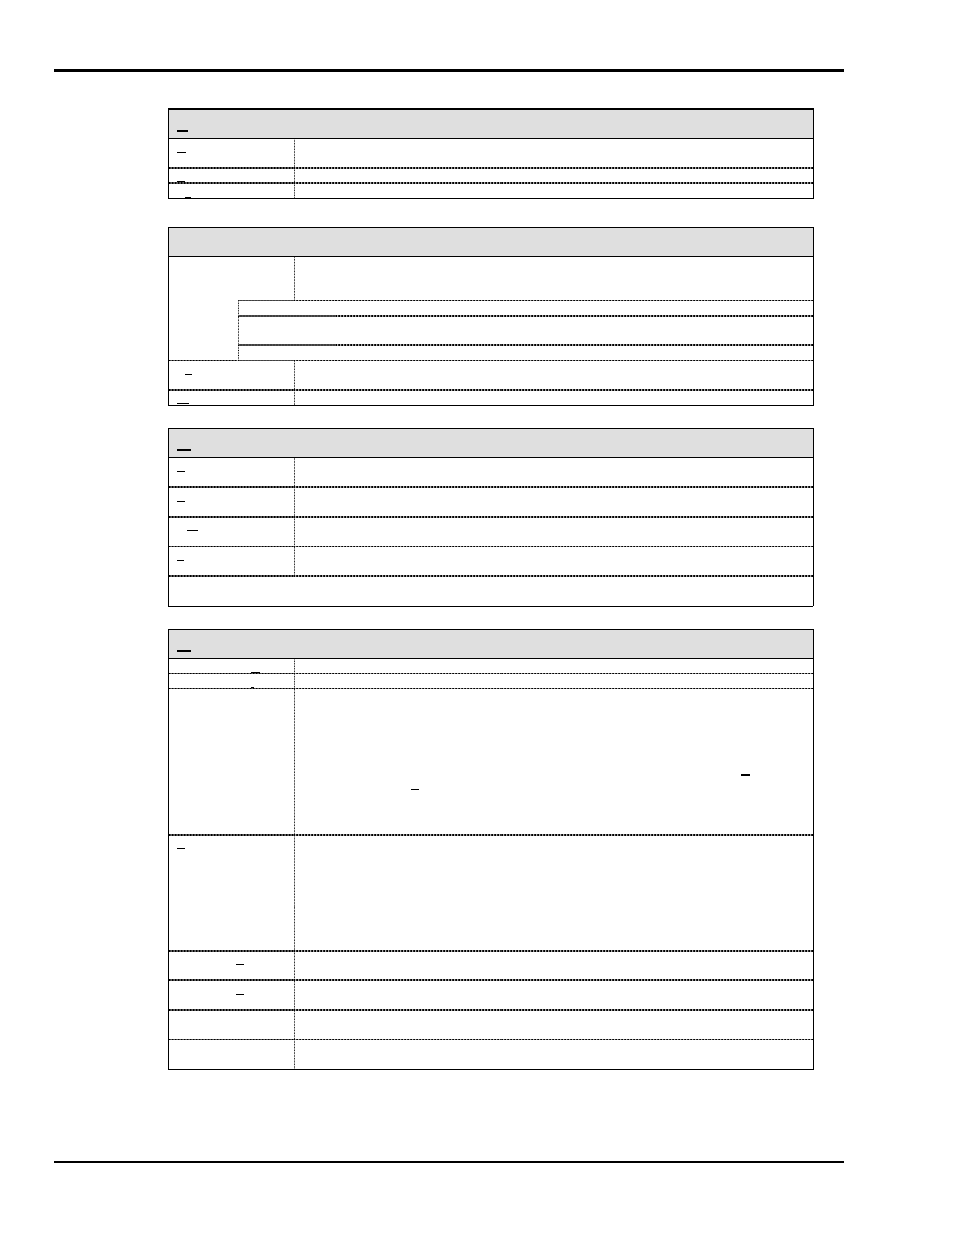
Menu Items
File
Open (Ctrl + O)
Opens a data file created by the data acquisition program. PostView automatically
detects whether the file contains ASCII or binary data.
Prints a snapshot of the present PostView Chart window.
Exit (Ctrl + X)
Exits the File menu and closes PostView.
Chart
Chart Display
Setup
Brings up the Chart Display Sub-menu with selections to: Open a Display Configuration
File, Save a Display Configuration File with present file name, or Save a Display
Configuration File with a new file name.
Open (F11)
Used to open a specific Chart Display Configuration file.
Save
Saves the Chart Display Configuration to disk. Saves to the file that was opened
from the Chart Display Setup Open menu.
Save As (F12)
Used to save the Chart Display Configuration file to disk, to a new (or existing) file.
Setup (Ctrl + E)
Accesses Display Configuration Setup dialog box, allowing you to edit the display
configuration.
Wizard (Ctrl + W)
Accesses the Chart Setup Wizard.
Go To
Percentage
(Ctrl+P)
Automatically scrolls the waveform such that the displayed waveform begins at the
specified percentage.
Scan Number
(Ctrl+S)
Automatically scrolls the waveform such that the displayed waveform begins at the
specified scan number.
Time
(Ctrl+m)
Automatically scrolls the waveform such that the displayed waveform begins at the
specified time.
Trigger Point
(Ctrl+T)
Automatically scrolls the waveform such that the displayed waveform begins at the trigger
point (t = 0).
Note: In PostView Version 3.x – If there is a Pre-trigger, then Pre-trigger and Post-trigger times (in seconds) are
displayed in the Go To menu’s dialog box.
Options
Zoom Graph Out
Allows more of a chart(s) to be seen by decreasing the dimensions.
Zoom Graph In
Zooms in on a chart(s), providing more detail to a smaller area of the chart(s).
Maximize Graph
Causes PostView to display one chart only. For example, if you were viewing 3 charts and
wanted to get a better view of Chart 2, you could use Maximize Graph so it would be
displayed using the full chart viewing area, as compared to using one third of the area.
The Maximize Graph feature can also be invoked by double-clicking in the chart region
of the chart you want to maximize.
Once you have maximized a chart, the pull-down menu option is replaced by a Restore
option. Selecting Restore from the menu returns the main window to its previous
multiple-chart viewing status. The restore feature can also be invoked by
double-clicking [or right-clicking] and selecting Restore graph from the pop-up menu.
Absolute time
(Ctrl+A)
PostView normally displays timestamp information in a relative format; +/- time from the
trigger point, see note. If the instrument and acquisition software that created the data
file supported timestamp logging, and the feature was enabled such that timestamp
information was saved with the data, then PostView can display these Absolute
timestamps (instead of the relative stamps). See following note.
Note:
Relative time format, typically uses 00:00:00.0 as the start time and shows other times as
hours, minutes, seconds and tenths which have elapsed since the start time. (Also see
PostView Timebase, page -15.)
Autoscale Current
Channel
For the currently selected channel, automatically generates a scale, in contrast to
manually assigning the scale.
Autoscale All
Channels
Automatically generates a scale for each channel in every chart of the selected group.
Show Grid
(Ctrl+G)
Allows grids to be turned off and on for all visible graphs. When a check appears in front
of an item, its indicator is on or visible.
Show Markers
(Ctrl+K)
Allows markers to be turned off and on for all visible graphs. When a check appears in
front of an item, its indicator is on or visible.