Toolbar – Measurement Computing WaveBook rev.3.0 User Manual
Page 118
6-4 PostView
WaveBook User’s Manual
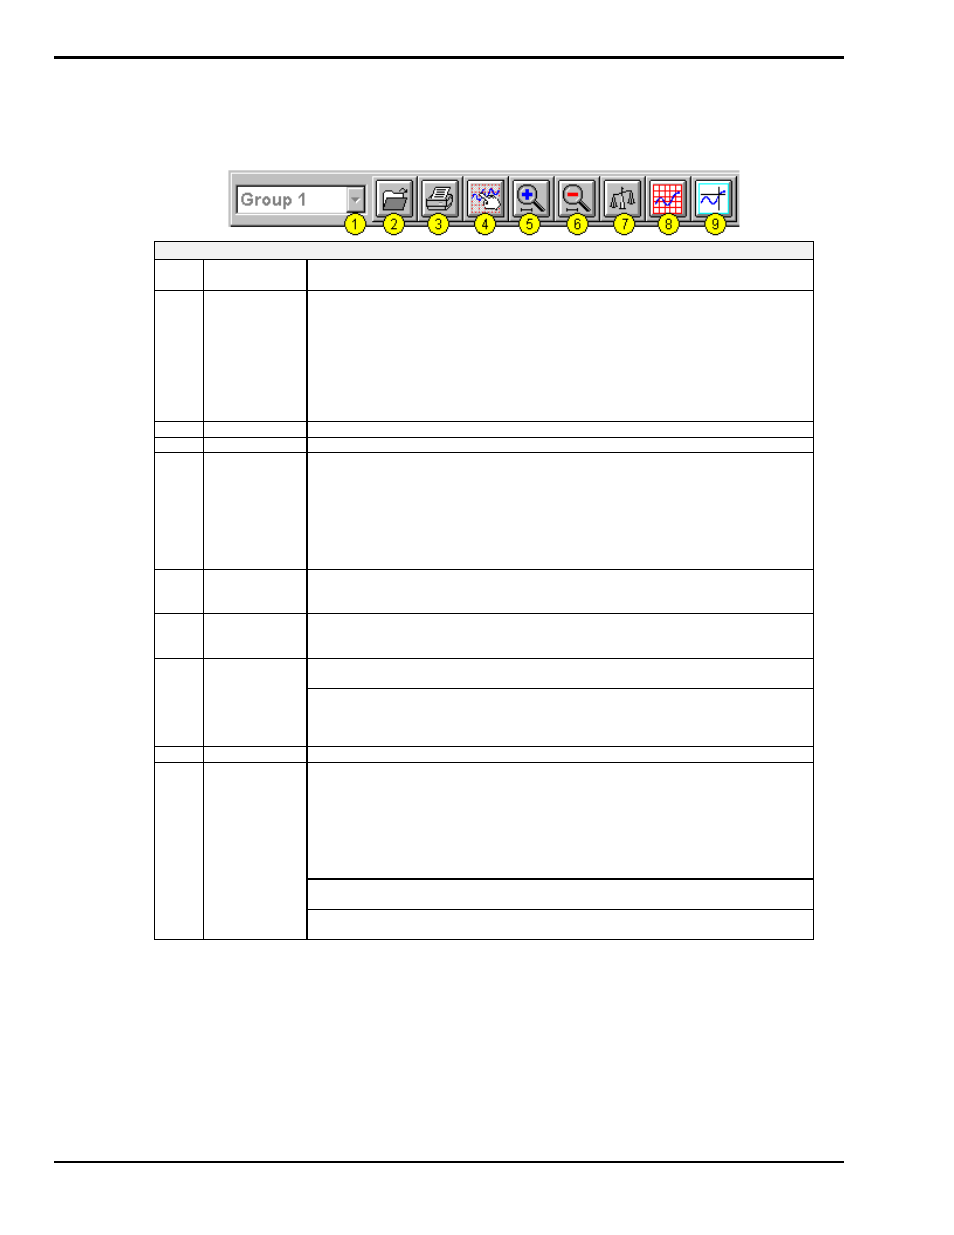
Toolbar
The following table explains PostView toolbar items. Note that PostView Menu items are discussed on
page -6.
PostView Toolbar Items
Item
#
Item
Description
1
Group Select
This feature indicates which chart group is being displayed. Clicking on the down arrow
(
τ
) reveals other chart groups configured by the user. To select a different chart group,
simply pull down the group list and select the desired group. The group list can be
obtained by any of the following control options: a) clicking the down arrow (
τ
), b) using
Ctrl + G on the keyboard, c) using the keyboard up or down arrow key, d) using the
page up or page down key. If using a control option other than “a,” you may need to
select the group select box by pressing the keyboard’s Tab key several times (until the
group select box is selected). When this happens the name of the currently selected
group appears in white on a dark background.
2
Open
Accesses the Open Data File window.
3
Sends a snapshot of the PostView chart(s) to an assigned printer.
4
Display
Configuration
The Display Configuration button accesses the Display Configuration Setup dialog box.
This box will also be displayed if manual setup is selected during use of the Wizard
Chart Setup program. Clicking on the button accesses a Display Configuration Setup
box, which displays the configured structure of the groups, charts, and channels. From
this box you can add or remove: (a) groups to the display configuration, (b) charts to a
group, (c) channels to chart. With the use of the mouse cursor you can also select a
chart or channel for additional editing. Display Configuration is discussed in more detail,
immediately after description of the pull-down menu options.
5
Zoom In
The Zoom In (+) button halves the visible timebase, showing less of the waveform. For
example, if 10 seconds of information is visible, clicking the Zoom In button will show
5 seconds.
6
Zoom Out
The Zoom Out (-) button doubles the visible timebase, showing more of the waveform.
For example, if 10 seconds of information is visible, clicking the Zoom Out button will
show 20 seconds.
7
Autoscale
Clicking the Auto Scale button adjusts the Y-axis scaling such that all waveforms fill
90% of the chart’s range. Affects all channels of the currently selected Group.
Y-axis Adjust
The Y-axis Adjust fields show the chart’s minimum and maximum for currently selected
charts in the engineering units shown. Auto Scaling of individual charts can be
accomplished from the pop-up menu that appears when you right-click on a chart.
A pop-up menu (item 20) is shown on the main window figure on page –2.
8
Show Grid
Places a grid on the chart (s), or removes the grid if already present.
9
Show Markers
Each chart can have a cross-hair for selecting a specific point on the waveform. The
time and magnitude at the marker point are displayed in the channel information
region, as shown for items (13) and (14) on page -5. The Markers start out at the far
left of every chart, showing the time and magnitude of the first visible point.
Ctrl+Left Mouse Button moves the markers from all the charts in unison.
The Options menu contains a function which allows you to turn markers on and off.
When a check appears in front of this item, its associated indicator is on or visible.
Selecting the menu item toggles the indicator (and the check mark) on and off.
Trigger Event
Marker
The Trigger Event Marker on the time axis shows the location of the trigger point.
(See figure, PostView TimeBase)
Stop Event
Marker
The Stop Event Marker on the time axis shows the location of the stop point.
(See figure, PostView TimeBase)
The Scroll Bar at the bottom of the PostView window allows the waveforms to be scrolled right or left in two ways:
1. When clicked on, the small left and right arrow boxes scroll the waveforms approximately 20%.
2. The plain scroll button shows the relative location of the visible region of the waveforms and can be
dragged along the scroll bar to any location desired.