Understanding groups, charts, and channels, Help – Measurement Computing WaveBook rev.3.0 User Manual
Page 121
WaveBook User’s Manual,
5-20-99
PostView 6-7
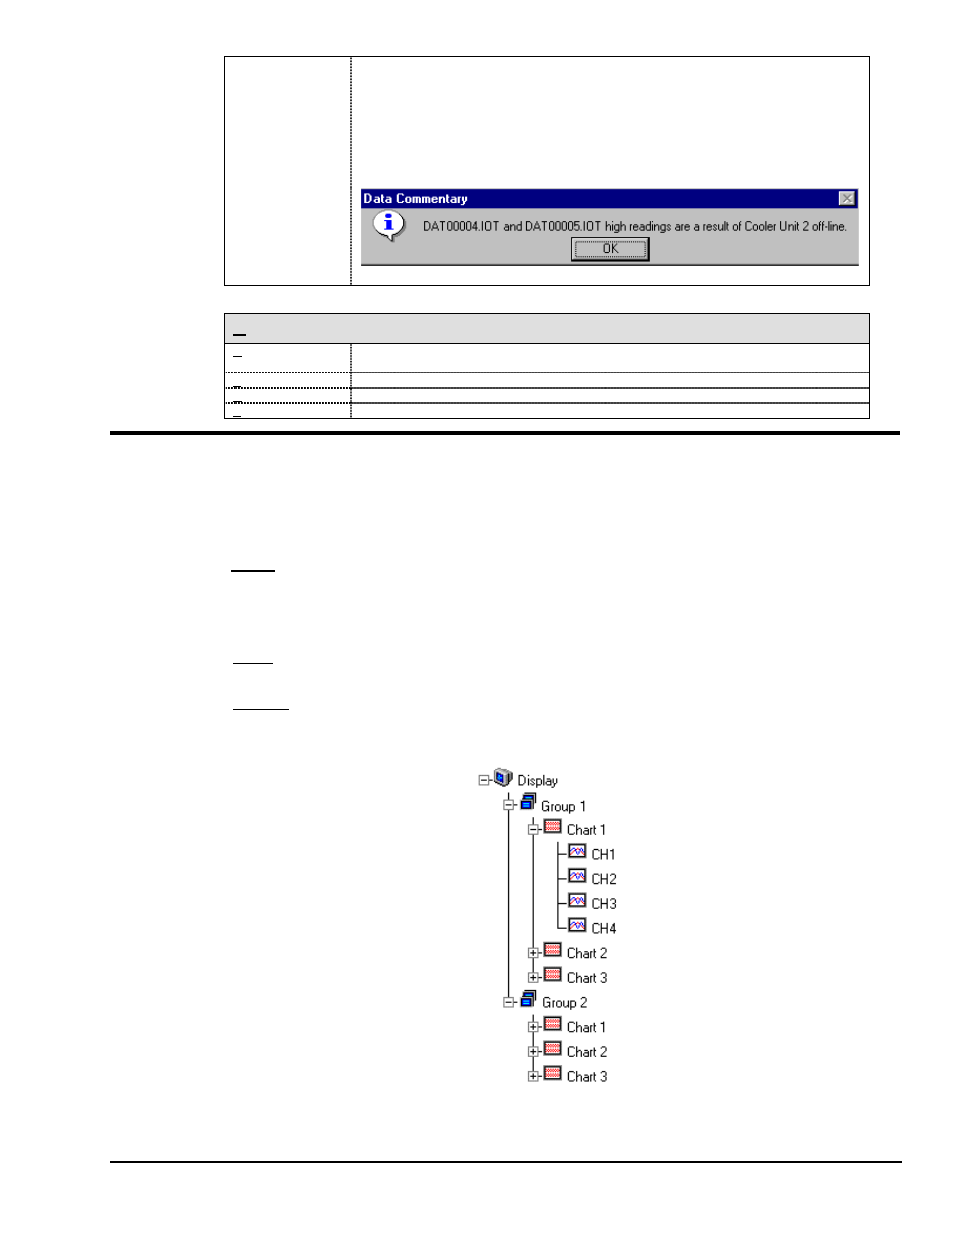
Data Commentary
(Ctrl+C)
This function is hidden, unless a comment has been added to the data header file. If such
a comment has been entered, then the Data Commentary option will be visible.
Selecting Data Commentary brings up a message box. The comment feature is
supported by certain acquisition software, and can only be used by PostView versions
3.3 or greater. For ChartView users: note that commentary can be entered in
ChartView’s Setup/Data Destination dialog box, providing the commentary feature is
enabled. To enable the feature in ChartView, start with the View pull-down menu and
navigate as follows: View
⇒ Options ⇒ Acquisition ⇒ (3) Enable PostView Comment
(refer to the software chapter, if needed.)
Example of a Data Commentary Message
Help
Contents
The initial PostView help screen provides an overview and listing of the help file contents.
A single topic can be selected for quick access to help information.
Search
Type a word or select one from the Show Topics list for quick access to help information.
Help on Help
Provides instructions on how to use a Windows Help system.
About
Provides PostView’s version number.
Understanding Groups, Charts, and Channels
As indicated in the figure on page -3, when no display configuration file is found, PostView opens the
Chart Setup Wizard to assist you in creating a display file. To make the best use of Chart Setup Wizard you
need to understand the relationship of Groups, Charts, and Channels. The Chart Setup Wizard feature is
discussed immediately following this text.
Group. “Group” refers to a group of charts. You can add and remove groups to your display, and you can
add or remove charts to each group. Depending on the capabilities of your PC, you can have up to 64
groups assigned to your display.
Note: PostView can only display data from one group at a time.
Chart. A “Chart” is a display area containing up to four channels. You can assign up to 16 charts per
group. Charts can be displayed with or without gridlines.
Channel. “Channel” refers to a signal channel. You can have up to 4 channels assigned to one chart.
Channels will be displayed in units of °C, °F, °K, °R, mV, V, or user defined units, depending on the
configuration and type of signal conditioning card which was used during data acquisition.
Relation of A Group to Charts and Channels