ADS Environmental Services IETG FlowHawk QR 775012 A4 User Manual
Page 271
6-92 IETG FlowHawk Manual
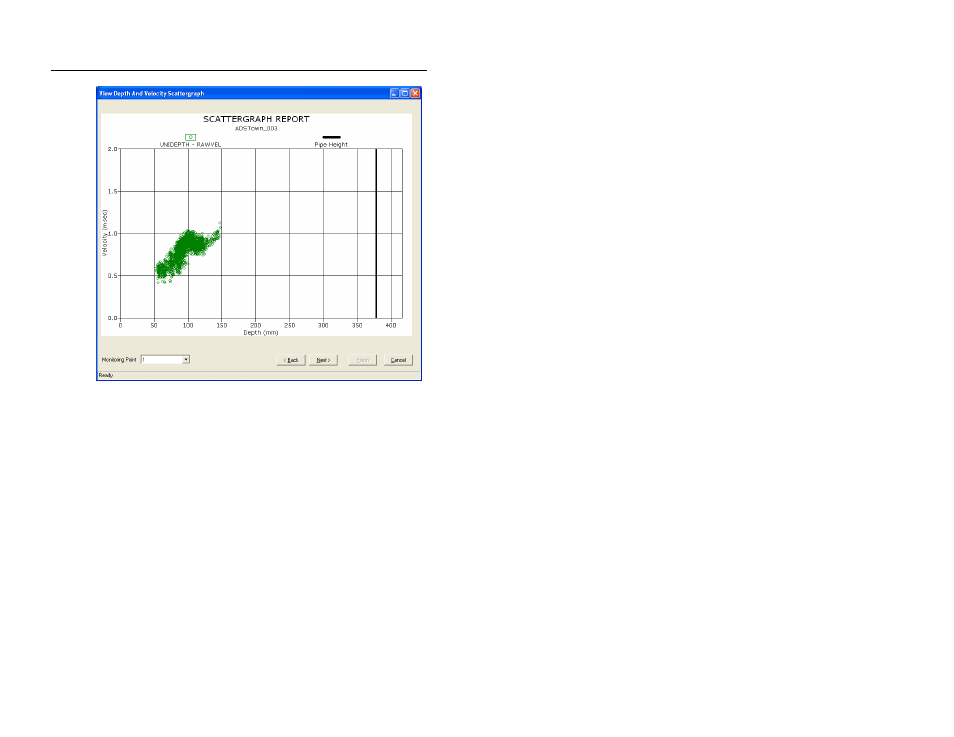
View Depth and Velocity Scattergraph – [location name] dialog
8. Review the data on the scattergraph, and then click on the Next
button. Under optimal conditions, the data on the graph should
reveal velocity increasing with depth.
The View Ultrasonic and Pressure Scattergraph – [location
name] dialog displays the collected ultrasonic and pressure
depth data in scattergraph format.