Vaisala viewLinc 4.3 User Manual
Page 147
Creating New Reports
viewLinc 4.3
4
|
4
139
want the report to generate, and how frequently you want it
generated.
Note: For large report data sets, we recommend that you schedule
report generation at a time when few Users are using the sys-
tem, such as after business hours.
6
On the Content tab, identify the data you want included in the
report:
•
Title Page
: Reviews contents of the report.
•
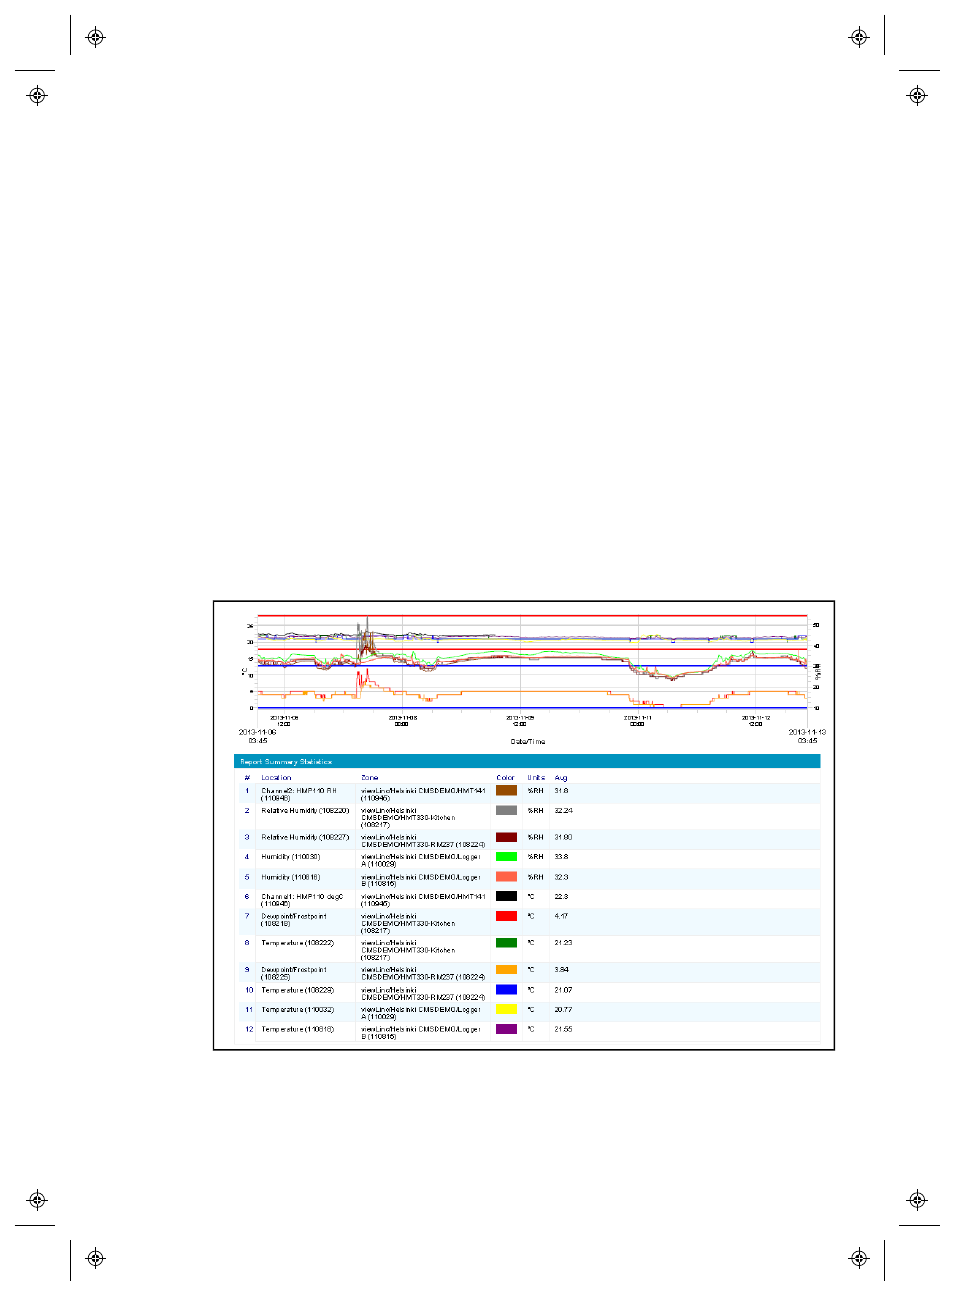
Include Trend Graph
: If you select this option, a graphical dis-
play of the data is included in the report.
You can also choose to include threshold lines, a statistics summary
(selected on the Statistic Settings tab), and all Location data on a
single graph (by default all Location data, according to measurement
unit, is included on a single graph). You can also choose to group
measurement units together on the same graph (a single graph can
only include up to 4 measurement unit types).