Zilog Z8F0130 User Manual
Page 134

Using the Integrated Development Environment
UM013037-1212
110
Zilog Developer Studio II – Z8 Encore!
User Manual
length of hex file records. This option is available only when the Intel Hex32 Records exe-
cutable format is selected.
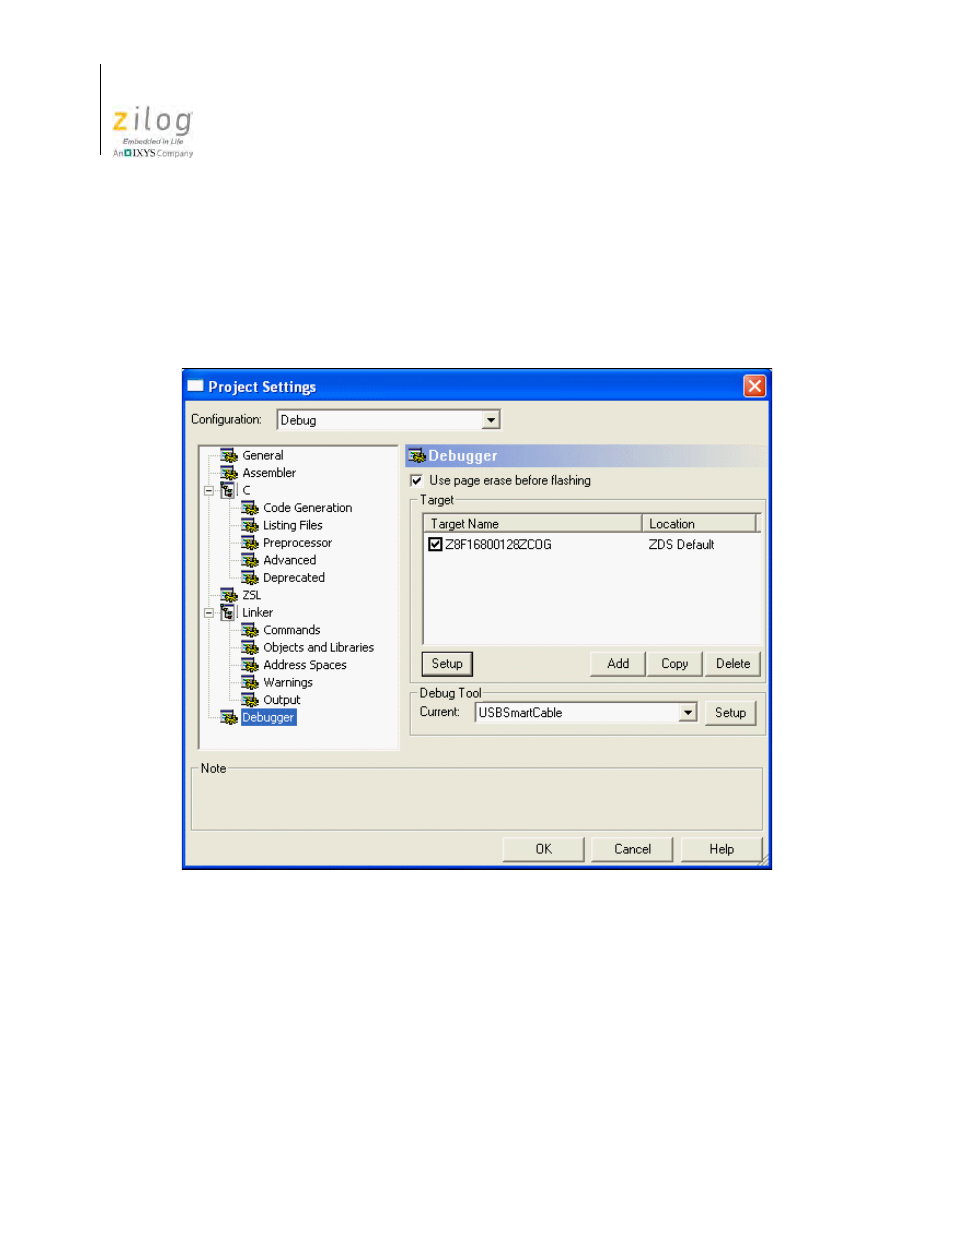
Debugger Page
In the
Project Settings
dialog box, select the Debugger page.
The source-level debugger is a program that allows you to find problems in your code at
the C or assembly level. The Windows interface is quick and easy to use. You can also
write batch files to automate debugger tasks.
Your understanding of the debugger design can improve your productivity because it
affects your view of how things work. The debugger requires target and debug tool set-
tings that correspond to the physical hardware being used during the debug session. A tar-
get is a logical representation of a target board. A debug tool represents debug
communication hardware such as the USB Smart Cable or an emulator. A simulator is a
Figure 66. Debugger Page of the Project Settings Dialog Box
- Z8F0131 Z8F0230 Z8F0231 Z8F0430 Z8F0431 Z8F043A Z8F0830 Z8F0831 Z8F083A Z8F1232 Z8F1233 Z8F0113 Z8F011A Z8F0123 Z8F012A Z8F0213 Z8F021A Z8F0223 Z8F022A Z8F0411 Z8F0412 Z8F0413 Z8F041A Z8F0421 Z8F0422 Z8F0423 Z8F042A Z8F0811 Z8F0812 Z8F0813 Z8F081A Z8F0821 Z8F0822 Z8F0823 Z8F082A Z8F0880 Z8F1621 Z8F1622 Z8F1680 Z8F1681 Z8F1682 Z8F2421 Z8F2422 Z8F2480 Z8F3221 Z8F3222 Z8F3281 Z8F3282 Z8F4821 Z8F4822 Z8F4823 Z8F6081 Z8F6082 Z8F6421 Z8F6422 Z8F6423 Z8F6481 Z8F6482 Z8FS021A ZMOT1AHH Z8FS040B ZMOT0BHH ZMOT0BSB Z8FMC04 Z8FMC08 Z8FMC16
