HP XP Performance Advisor Software User Manual
Page 235
LDEV in the component selection tree, if you are aware of the LDEV name. For more information,
see
“Searching for components” (page 266)
:
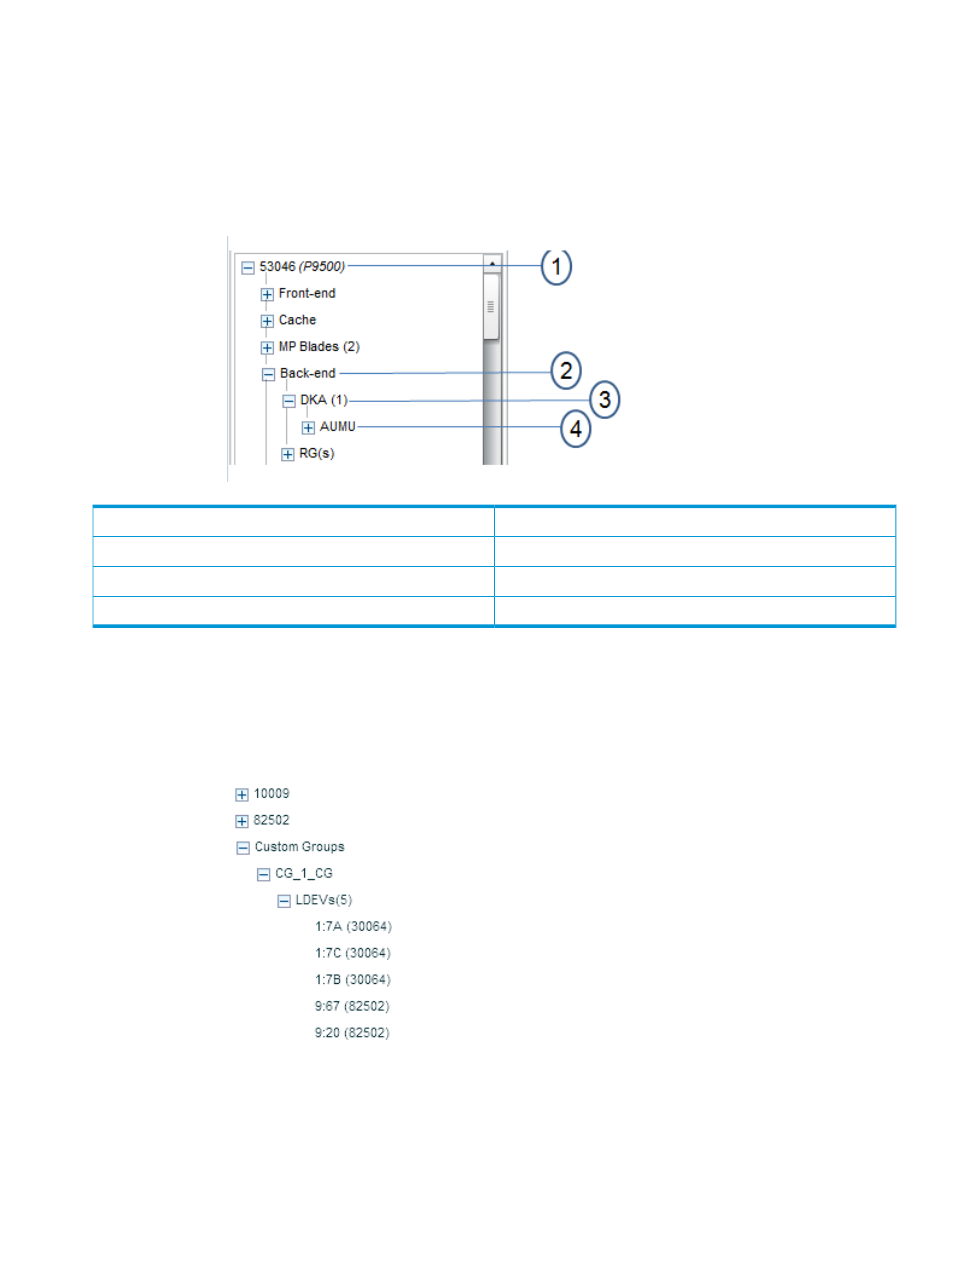
•
Click
the plus (+) sign for an XP or an XP7 disk array and select components from the list,
for
which you want to view the performance graphs. The following image displays the
hierarchy
for component selection.
For more information on selecting components, see
“Selecting components and metrics”
Node
1
Main category
2
Component type
3
Component
4
•
Click
the plus (+) sign for Custom Groups and select an individual custom group from the
list
followed by the associated LDEVs for which you want to view the performance
graphs.
The DKC numbers of the XP and the XP7 disk arrays to which the LDEVs belong
are
also displayed in brackets beside the LDEV IDs.
Accordingly, the applicable metrics for the selected components are populated in the Available
Metrics Choose Metric Category list. The metrics are grouped under different metric categories.
By default, the metrics for the first metric category in the list are automatically displayed in the
Metric column.
Plotting charts 235
- StorageWorks MSL6000 Tape Library (61 pages)
- Лент-е накопители HP StoreEver DAT (64 pages)
- Лент-е накопители HP StoreEver DAT (50 pages)
- StoreEver Ultrium Tape Drives (60 pages)
- Linear Tape File System Software (28 pages)
- Linear Tape File System Software (25 pages)
- StoreEver Ultrium Tape Drives (78 pages)
- StoreEver Ultrium Tape Drives (76 pages)
- Linear Tape File System Software (20 pages)
- StoreEver Ultrium Tape Drives (61 pages)
- StoreEver TapeAssure Software (40 pages)
- StoreEver Ultrium Tape Drives (75 pages)
- 2600fx Optical Disk Drive (65 pages)
- Ленточный автозагрузчик HP StorageWorks DAT 72x10 (58 pages)
- 2000fc Modular Smart Array (150 pages)
- StorageWorks 1000 Modular Smart Array (72 pages)
- StorageWorks 1000 Modular Smart Array (81 pages)
- StorageWorks 1500cs Modular Smart Array (48 pages)
- StorageWorks 1500cs Modular Smart Array (52 pages)
- StorageWorks 1500cs Modular Smart Array (71 pages)
- Servidor de almacenamiento HP ProLiant DL585 G2 (152 pages)
- Sistemas de almacenamiento de red HP StorageWorks X3000 (152 pages)
- Software de HP StoreVirtual VSA (85 pages)
- Software de HP StoreVirtual VSA (127 pages)
- X500 Data Vault (331 pages)
- StorageWorks 1000i Virtual Library System (122 pages)
- 200 Storage Virtualization System (176 pages)
- XP Array Manager Software (101 pages)
- StorageWorks XP Remote Web Console Software (20 pages)
- StorageWorks MSA 2.8 SAN Switch (22 pages)
- StorageWorks MSA 2.8 SAN Switch (104 pages)
- StorageWorks MSA 2.8 SAN Switch (270 pages)
- StorageWorks MSA 2.8 SAN Switch (307 pages)
- StorageWorks All-in-One SB600c Storage Blade (72 pages)
- StorageWorks All-in-One SB600c Storage Blade (80 pages)
- StorageWorks All-in-One SB600c Storage Blade (78 pages)
- StorageWorks All-in-One SB600c Storage Blade (60 pages)
- ProLiant DL585 G2 Storage-Server (150 pages)
- Data Protector Express Basic-Software (83 pages)
- Data Protector Express Basic-Software (93 pages)
- ProLiant DL185 G5 Storage Server (174 pages)
- ProLiant High Availability Storage Server (72 pages)
- 2000I G2-Modular-Smart-Array (48 pages)
- P2000 G3 MSA Array Systems (58 pages)
- StorageWorks 2000fc G2 Modular Smart Array (76 pages)