10 using charts, Introduction, Charts screen – HP XP Performance Advisor Software User Manual
Page 230: Introduction charts screen
10 Using charts
This chapter discusses the following topics:
•
•
Introduction
You can plot performance graphs to view historical data of components that belong to the same
or different XP disk arrays and XP7 disk arrays. Graphical representation of components performance
metrics is especially useful when you want to compare similar components of different XP and XP7
disk arrays to determine their performance and observe trends. You can plot performance graphs
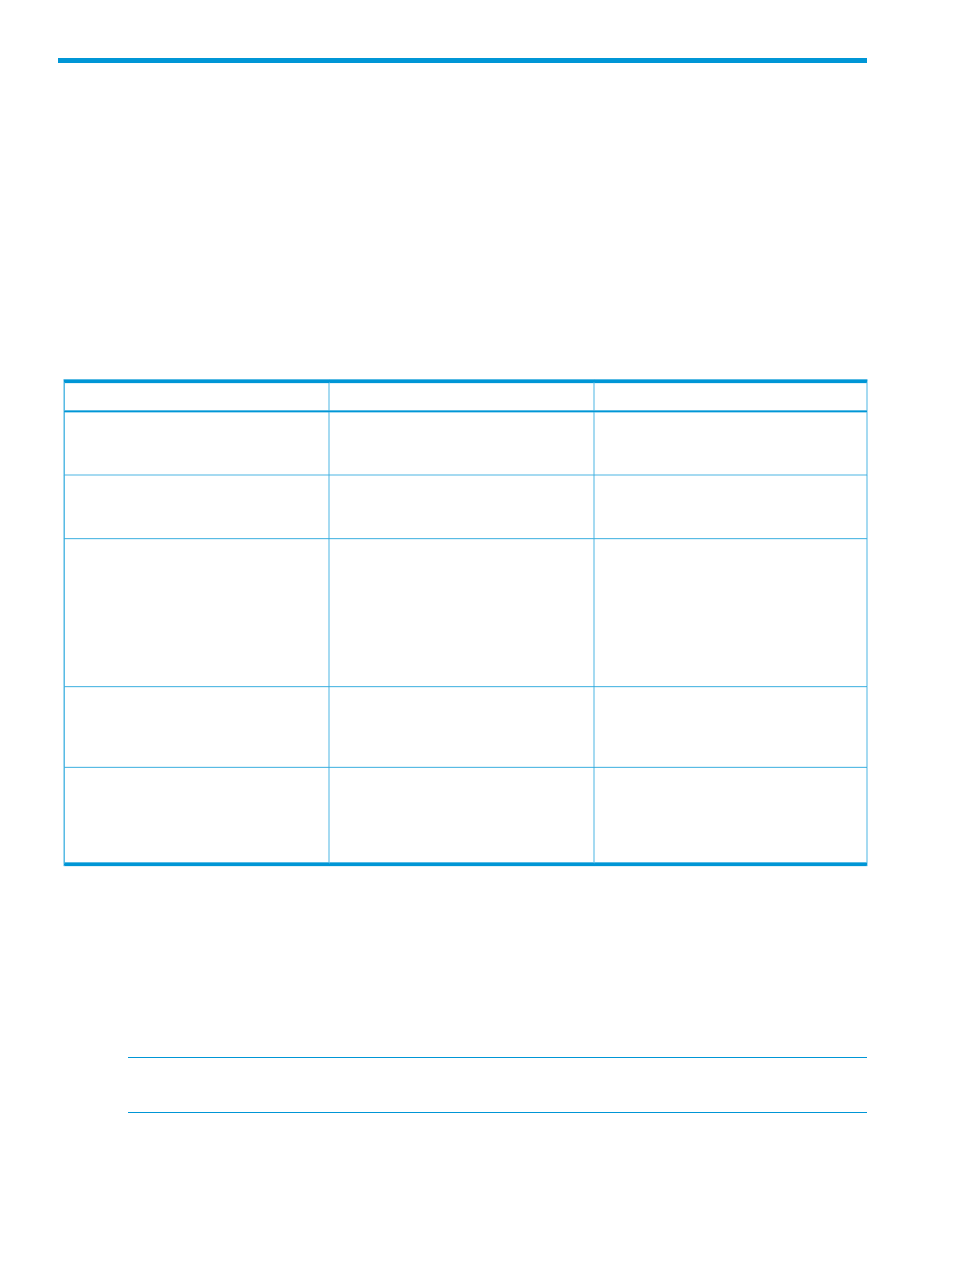
of components for different metrics that belong to the following metric categories:
Unit of measurement
Description
Metric category
IO/second
Provides metrics for measuring the I/Os
from a host to the XP and the XP7 disk
arrays
Frontend IO Metrics
MB/second
Provides metrics for measuring the
throughput of the I/Os from a host to the
XP and the XP7 disk arrays
Frontend MB Metrics
% utilization
Provides metrics for measuring the CPU
cycles of the processors that reside on the
Utilization Metrics
CHAs and DKAs in the XP disk arrays,
and on the MP blades in the P9500/XP7
disk arrays. In addition, this category also
provides metrics for measuring the cache
and the RAID groups utilization in the XP
and the XP7 disk arrays.
Number of reads
Provides metrics for measuring the number
of reads and writes on the disks in the XP
Backend Metrics
Number of writes
and the XP7 disk arrays, applies to RAID
groups and physical LDEVs.
Read response time
Provides metrics for measuring the read
response time or the write response time
Response Time Metrics
Write response time
for the read I/O requests or the write I/O
requests on the XP and the XP7 disk
arrays.
The metrics that you select are component driven, where specific set of metrics are displayed for
the selected components. Related components are categorized to be available for selection under
a common category. For example, all the DKA pairs and their MPs, RAID groups and associated
physical LDEVs and pool LDEVs are grouped in the Back-end category. You can also analyze the
performance of a component by viewing its data points collected at different collection rates in the
same chart. You can compare components across the XP and the XP7 disk arrays based on the
following metric categories. (Ensure that you select every element that you want to appear in your
chart, because the system charts only those elements that are specified):
NOTE:
Firmware version later than 50.09.33 snapshot PIDs are available for the XP12000 and
the XP10000 Disk Arrays.
Charts screen
The Charts screen appears when you click Monitoring+Charts in the left pane.
230 Using charts