Dashboard statistics – HP XP Performance Advisor Software User Manual
Page 107
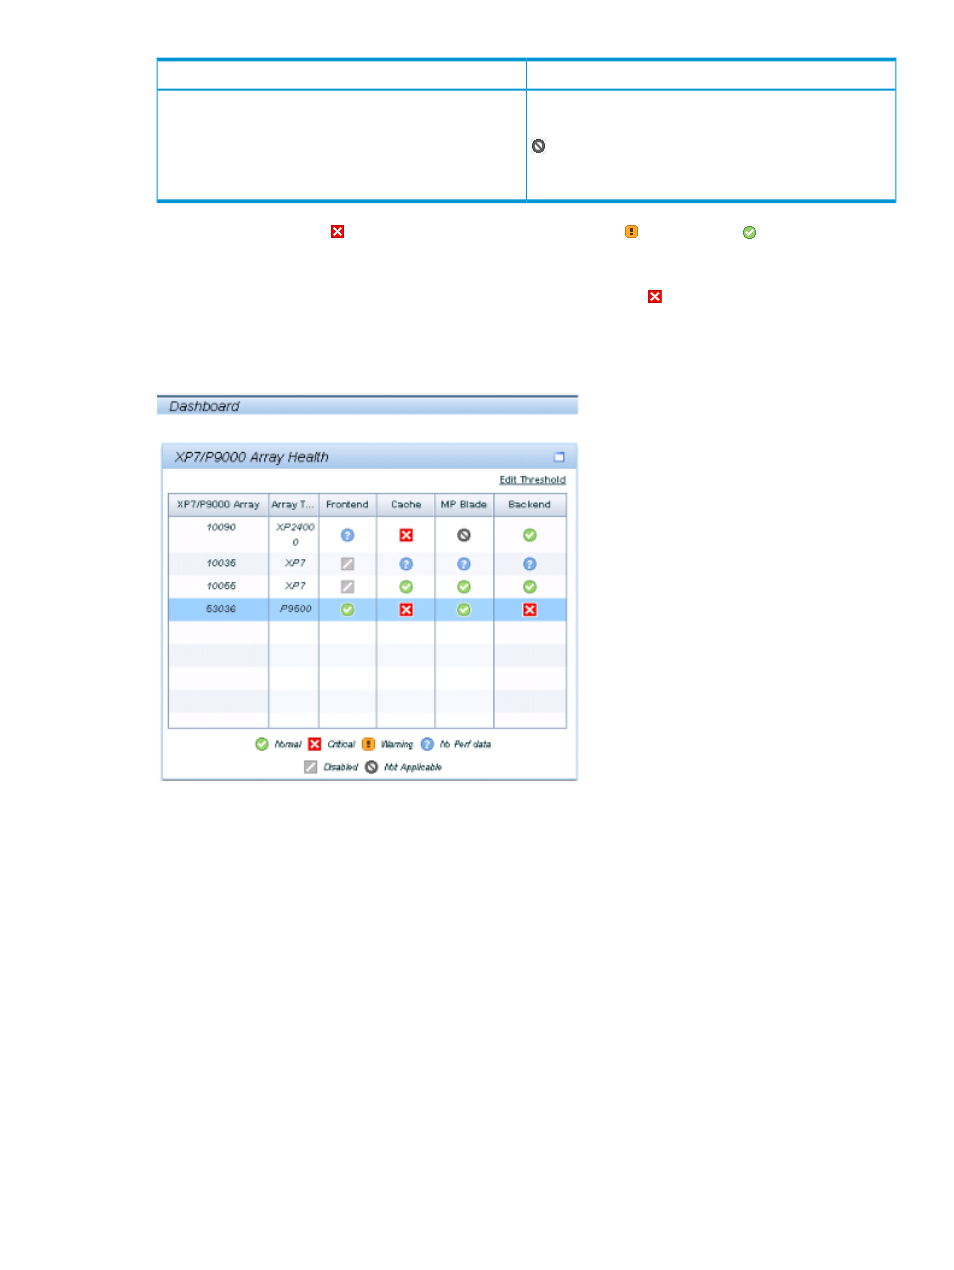
Description
Status icon
Indicates that the particular category is not applicable for
the selected array.
appears
in the MP Blade category for the XP disk arrays,
as
the MP blade related metrics are applicable only for
the
XP7 disk arrays.
Further, the status icon
(Critical) takes precedence over the
(Major) and
(Normal) status
icons. For example, the Frontend statistics for a P9500 Disk Array shows that the usage of all
components is either at the normal level or almost reaching the defined threshold limits. However,
the overall usage status in the Frontend category still displays as
(Critical). It implies that there
might be one or more components in the Frontend category whose usage has crossed the defined
threshold limit for a particular metric during the specified threshold duration. Such components
need your immediate attention. For more information, see
“Dashboard statistics” (page 107)
.
The
overall usage status of an XP or an XP7 disk array in a category is based on the usage of
components
in that category. The usage data is collected only on those metrics whose threshold
limits
are set on the Threshold Setting screen.
For
example, assume that you have set the threshold limit for only the RG Seq Reads (IOPS) (Avg
Seq
Reads) metric in the Backend category. The status icon displayed in the XP/XP7Array Health
section
in the Backend category is based on the usage of individual components corresponding
to
the RG Seq Reads (IOPS) (Avg Seq Reads) metric during the specified threshold duration.
Dashboard statistics
Click
a status icon in the XPArray Health XP/XP7Array Health section in the Frontend, Cache,
Backend,
or the MP Blade category to view the associated components and their average usage
data
in the respective Statistics section.
The following image shows the frontend statistics for 10116, which belongs to the XP24000 disk
array.
Viewing dashboard 107