West Control Solutions Pro-EC44 User Manual
Page 48

Pro-EC44 2-Loop Graphical Profile Controller & Recorder
Pro-EC44 Product Manual - 59540-1 October 2013
Page 41
Clear Latched
Outputs
Hold down D or U for 3 seconds to clear the selected latched output
– An
output will only reset if the condition that caused it to latch on is no-longer
present.
◘ only shown if set to do so in Display Configuration.
Recorder Memory
Full Warning
Indicates that the Data Recorder memory is full and that recording has either
stopped or is overwriting older data if in FIFO recording mode.
Manual Recording
Trigger
Set the manual recording trigger on or off.
◘ only shown if set to do so in Display Configuration.
Note: Setting the manual trigger to off may not stop the
recording. Data recording will still take place if another recording
trigger is active.
Recorder Status
Information
Shows the recording status
(“Stopped” or “Recording”); icons for any active
recording triggers; the recording mode (FIFO or Record Until Memory Is
Used); the approximate recording time remaining* and a memory usage bar-
graph. In FIFO mode, the time re
maining is replaced with “FIFO” when full.
*If the status of alarms is recorded, extra samples are taken when the alarms
change state reducing the available recording time. Take this into account
when determining if there is sufficient memory available.
Icons for Active Recorder Triggers
Manual
Record ON
Digital Input
Record ON
Profile
Record ON
Alarm
Record ON
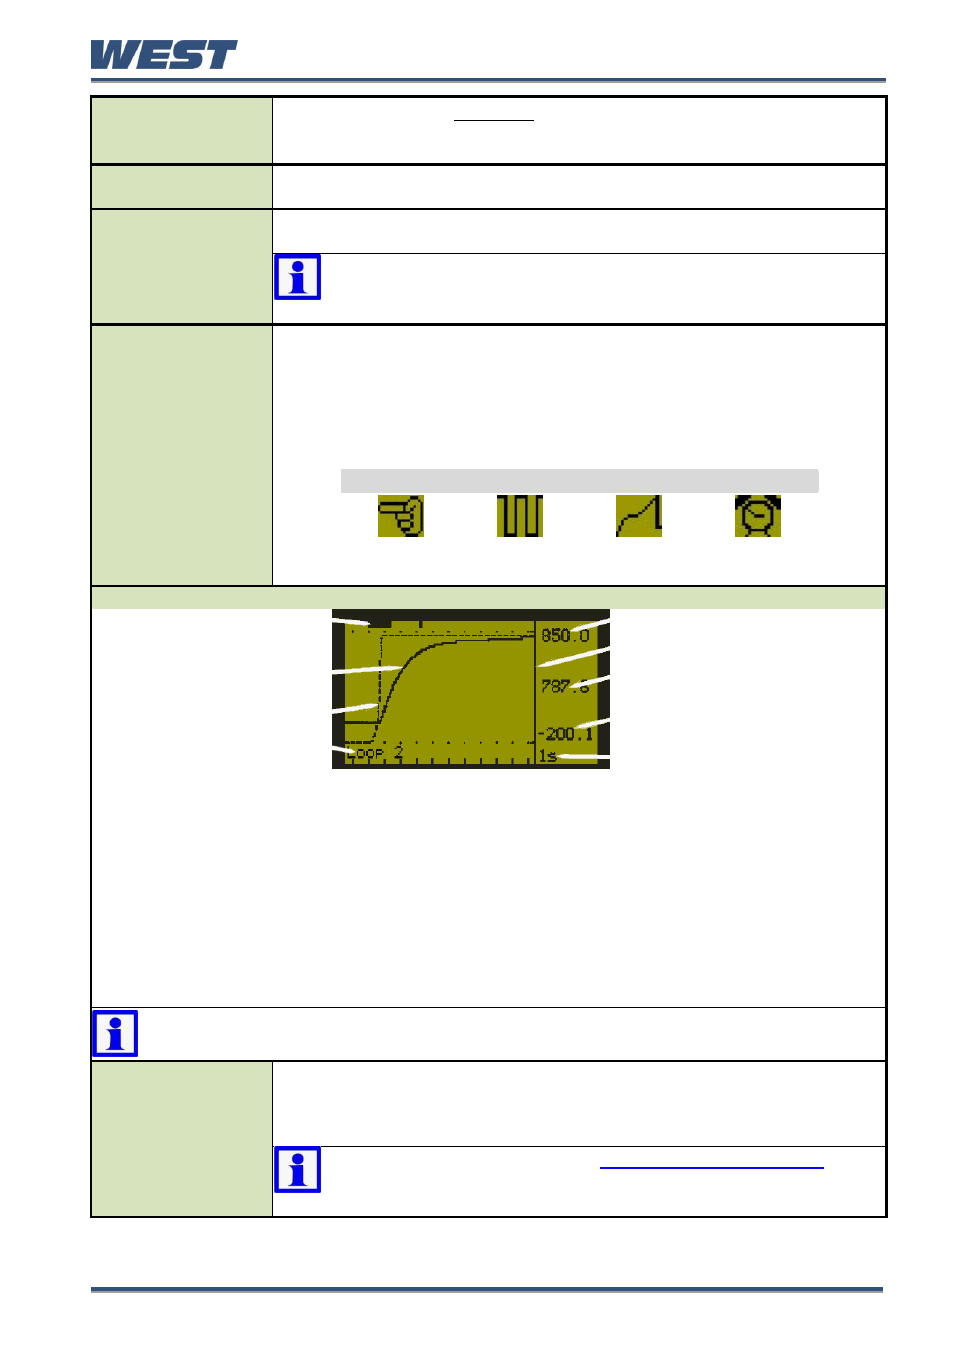
Trend Views: One per Control Loop
Active Alarm(s)
Trend Upper Scale Value
Cursor Line
Process Variable Trend
PV Value At Cursor Line
Setpoint Trend (dotted)
Trend Lower Scale Value
Loop No, & Time Markers
(10 samples per marker)
Sample Interval (or time at
cursor line)
TREND VIEW
Trend views can be shown of each loop. They are auto-scaling graphs with alarm indication and other
process information. The trend can be set to show the process variable only; the process variable &
setpoint (dotted line), or the minimum and maximum value of the process variable measured since
the last sample. Any active alarm(s) are indicated above the graph.
Graph types and data sample intervals 1 sec to 30 mins) are set in Display Configuration.
Trend scale values adjust automatically to visible data (between 2 to 100% of the input span).
120 data points are visible. Pressing D or U moves the cursor line back through the graph to
examine up to 240 data points. The process variable value of that data point is shown to the right of
the cursor line and the sample rate value is replaced by the time represented by the cursor position.
◘ only shown if set to do so in Display Configuration.
Note: Trend data is not retained at power down or if the sample interval is
changed.
- Custom Display
Screens
You can copy up to 50 configuration menu parameters into normal operation
mode using the PC software. These extended operator mode screens appear
at the end of the normal sequence. If the parameter is normally displayed on
screen with another parameter, both parameters will appear.
Note: In this mode screens are not pass-code protected, they
can be freely adjust. It is possible to make operation m
ode “read
only”, including any custom screens from Display Configuration.
