12 configuring monitor, Figure 197 bandwidth management: statistics, Table 145 bandwidth management: statistics – ZyXEL Communications 70 Series User Manual
Page 415
ZyWALL 5/35/70 Series User’s Guide
415
Chapter 25 Bandwidth Management
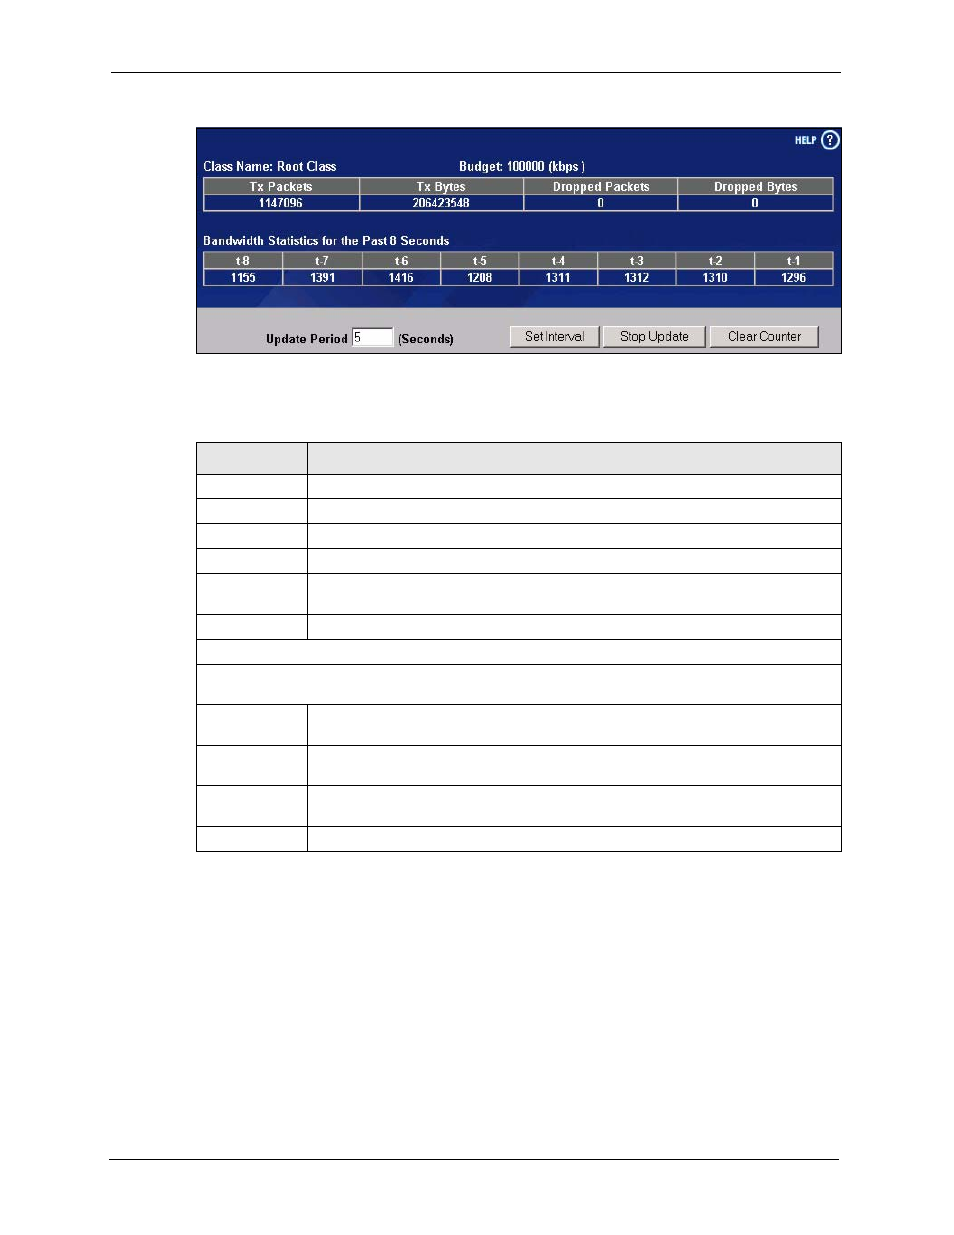
Figure 197 Bandwidth Management: Statistics
The following table describes the labels in this screen.
25.12 Configuring Monitor
To view the device’s bandwidth usage and allotments, click ADVANCED, BW MGMT, then
the Monitor tab. The screen appears as shown.
Table 145 Bandwidth Management: Statistics
LABEL
DESCRIPTION
Class Name
This field displays the name of the class the statistics page is showing.
Budget (kbps)
This field displays the amount of bandwidth allocated to the class.
Tx Packets
This field displays the total number of packets transmitted.
Tx Bytes
This field displays the total number of bytes transmitted.
Dropped
Packets
This field displays the total number of packets dropped.
Dropped Bytes
This field displays the total number of bytes dropped.
Bandwidth Statistics for the Past 8 Seconds (t-8 to t-1)
This field displays the bandwidth statistics (in bps) for the past one to eight seconds. For example, t-1
means one second ago.
Update Period
(Seconds)
Enter the time interval in seconds to define how often the information should be
refreshed.
Set Interval
Click Set Interval to apply the new update period you entered in the Update Period
field above.
Stop Update
Click Stop Update to stop the browser from refreshing bandwidth management
statistics.
Clear Counter
Click Clear Counter to clear all of the bandwidth management statistics.