Test levels, Waveform display tab, Operator observations tab – AMETEK CTS 3.0 User Manual
Page 124

Compliance Test System 3.0
User Manual
120
11.4
Test Levels
The test sequence implemented by this test consists of a series of voltage and phase unbalance
variations consistent with commonly found phenomena on the public utility power grid. The
objective of this test is to evaluate a product for immunity from such variations.
Voltage unbalances are applied at different levels for different product categories. The user must
determine the product class and select the appropriate test level. During the test run, voltage and
phase changes are applied. The voltage levels and phase shifts are determined by the values set
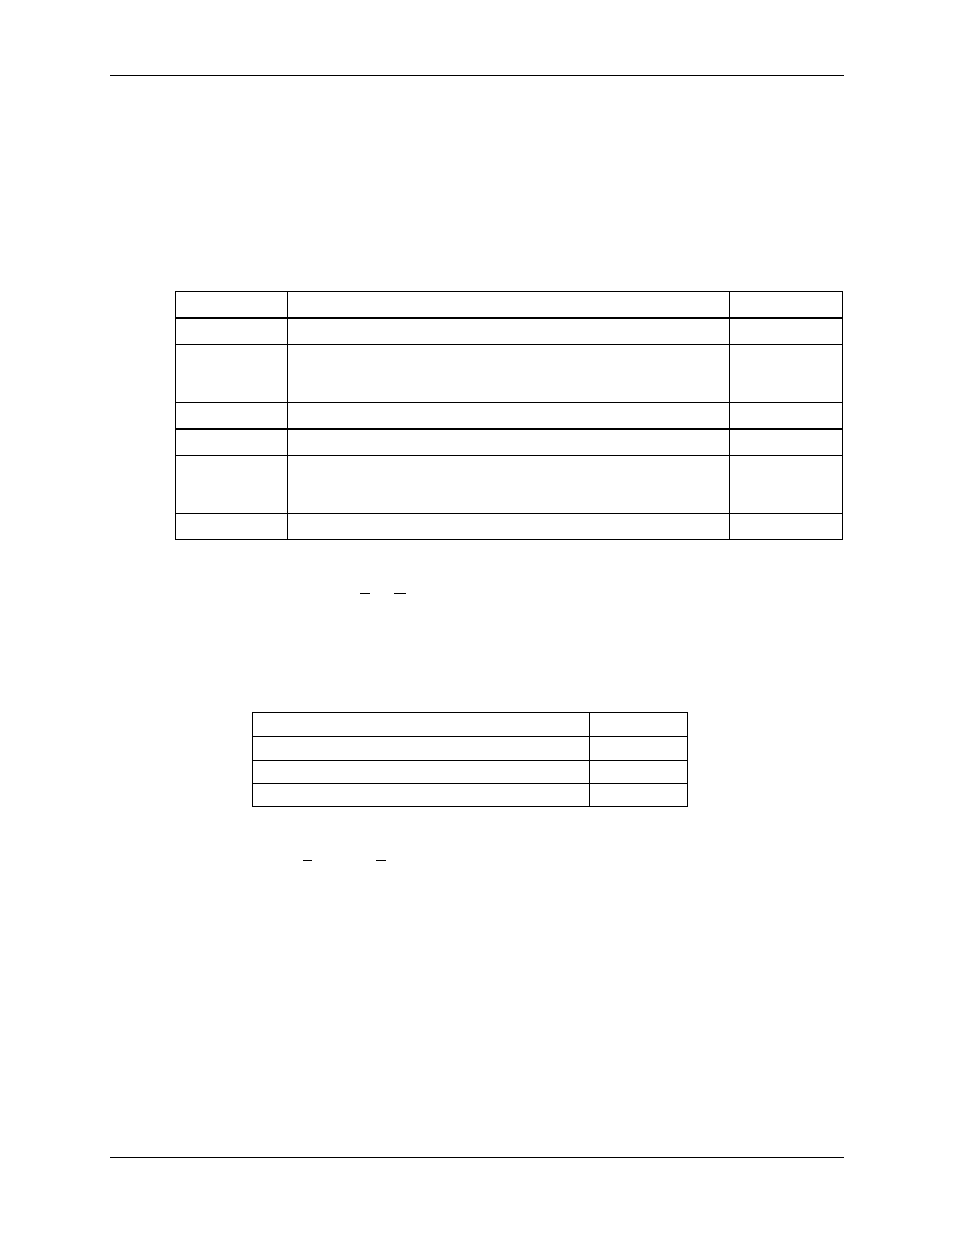
in the data entry grid. The various columns in the test data setup are as follows:
Parameter
Description
Range
Test #
Number of the test. There are three possible tests, 1, 2 and 3.
Fixed
Output
Indicates phase voltage for which level and phase is to be applied.
For each test number, the test will be repeated three time using the
following phase rotations: ABC, BCA, CAB
Fixed
% of Unom
Indicates voltage level to change to in % of nominal voltage.
50 to 150
Angle
Phase angle to shift to for each test number and phase in degrees.
0 to 360
Ku2
Unbalance factor. This value is shown for reference only and is
based on the test levels and phase shifts. It is not directly used to
program the AC source.
Time (s)
Time in seconds to hold the unbalance condition
0.0 to 9999
These parameters can be entered on screen by the operator or loaded from disk. To load a new
test or test class, select the File, Open menu. The default location for IEC test files is:
C:\Program Files\California Instruments\Cigui32\IEC_Test.
Or
C:\Program Files\California Instruments\CiguiSII\IEC_Test.
The following four IEC 61000-4-27 test files are distributed with the CIGui32 or CIGuiSII program:
File Name
Test Class
Class2.427
2
Class3.427
3
ClassX.427
X
The user may create as many test files as desired using the data entry grid. Changes made can
be saved using the File, Save A
s… menu entry.
11.5
Waveform Display Tab
This tab displays the three phase output voltage waveforms and their respective phase angles.
Each phase is shown in a different color. This waveform capture is started 10 msec prior to each
voltage and phase change and covers a period of about 100 msec. The last unbalance data
display is incorporated in the test report.
11.6
Operator Observations Tab
This tab may be used to enter any comments concerning the EUT behavior. Any text entered on
this page will become part of the test report. Note that this information is not saved any where
other then as part of the test report.
