The openlns ct browser toolbar, Customizing the browser – Echelon IzoT Commissioning Tool User Manual
Page 188
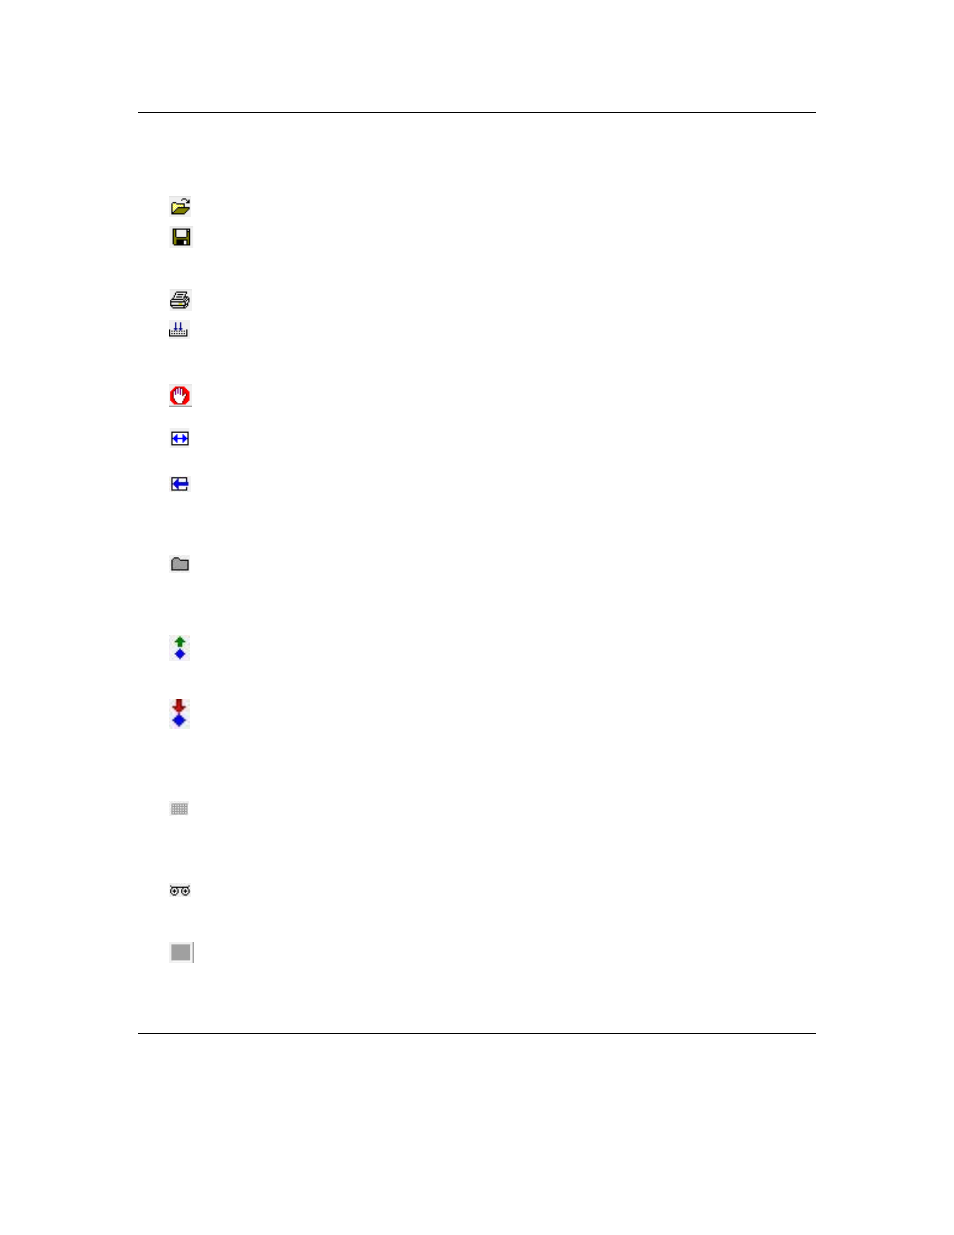
The OpenLNS CT Browser Toolbar
You can use the OpenLNS CT browser toolbar to perform many browser functions quickly. The toolbar
contains the following buttons:
Open
Opens an existing browser file. See Customizing the Browser.
Save
Saves changes to a browser file. If the browser file is new, the Save
As dialog opens. Name the file and choose a folder in which to save
the file. See Customizing the Browser for more information.
Prints the data in the Browser window.
Monitor All On
Turns monitoring on for all network variables displayed in the
current Browser window. See Monitoring Network Variables for
more information.
Monitor All Off
Turns monitoring off for all network variables in the current Browser
window. See Monitoring Network Variables for more information.
Adjust
Columns
Automatically sizes each column displayed in the Browser window
to fit the longest string in that column.
Refresh All
Updates the Browser window with all current network variable and
configuration property values. If any names of the displayed objects
have been changed using another tool, the displayed names are
updated.
Properties
Allows you to view and set properties for the currently selected
network variable or configuration property object. See Updating
Network Variable and Configuration Property Properties for more
information.
Get Value
Refreshes the value for the currently selected network variable or
configuration property. You can only update network variable
values if you are attached to the network.
Set Value
Changes the value of the currently selected input network variable or
writeable configuration property to the value indicated in the Value
box located right of this button. For enumerated values, click the
down arrow to select from the possible values. Network variable
values can only be modified if you are attached to the network.
Table
Opens a dialog that displays the selected configuration property
values in a table (only for configuration properties that contain a list
or table of values). See Updating Network Variable and
Configuration Property Values for more information.
Details
Displays the details of the selected network variable or configuration
property. See Updating Network Variable and Configuration
Property Values for more information.
Display
Messages
Displays a log of error messages received while the browser is
active. The Display Messages button is located at the bottom left
corner of the browser. See Displaying Error Messages for more
information.
Customizing the Browser
You can hide rows and columns in the browser to make it easier to view just the data you want to
monitor and control. For example, you may be viewing data from devices in a single subsystem;
172
Monitoring and Controlling Networks