Viewing a spectrum table – SATEC PM180 Operation Manual User Manual
Page 147
Chapter 14 Viewing Log Files
Viewing Waveforms
PM180 Substation Automation Unit
145
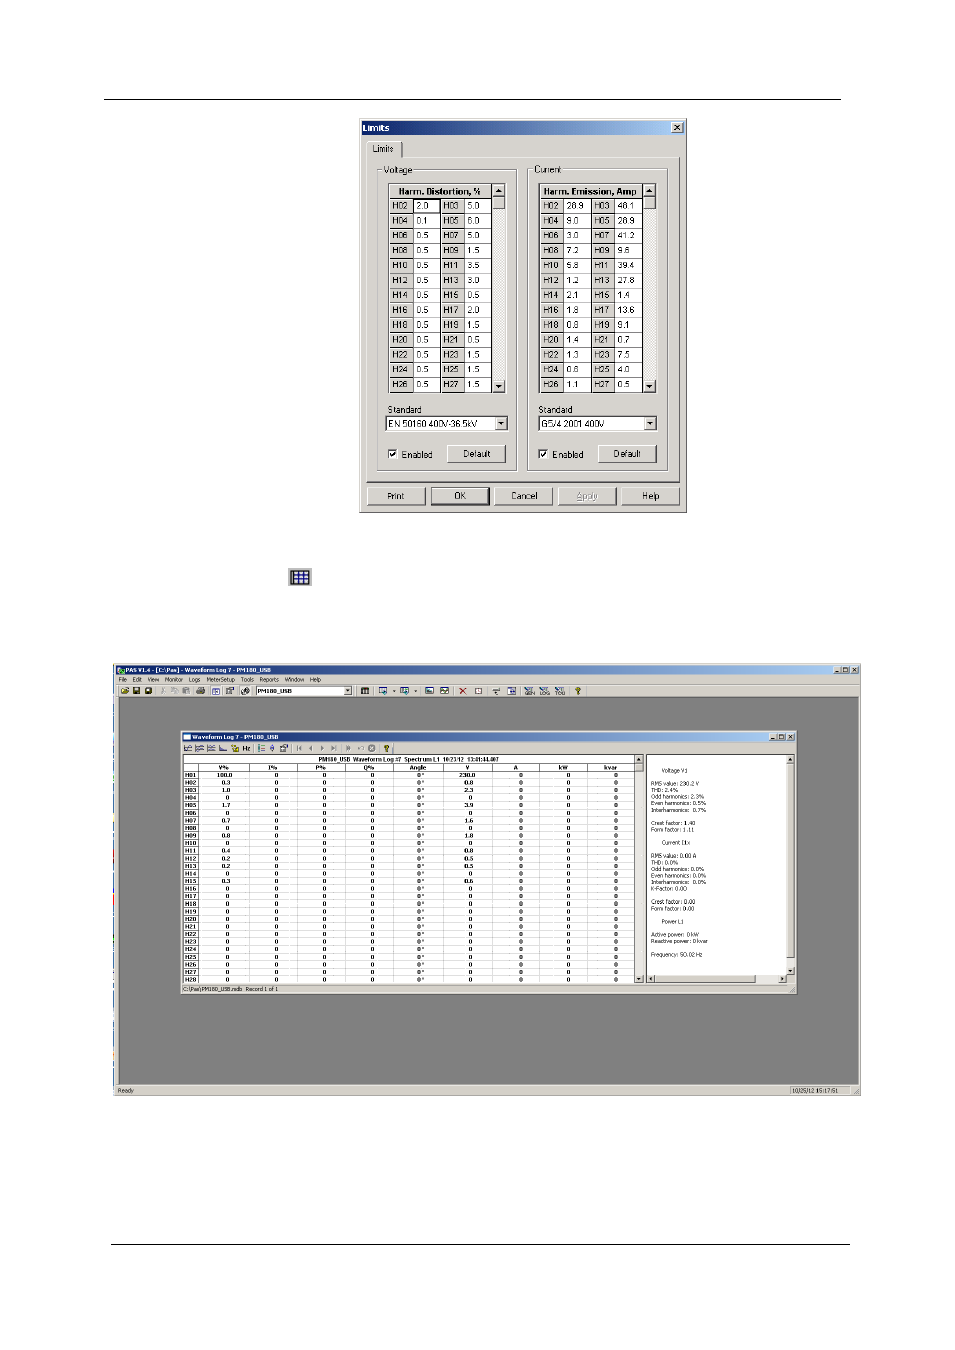
Viewing a Spectrum Table
Click on the
button on the local toolbar to display the harmonics spectrum in a
tabular view for a selected phase or for all phases together.
The spectrum table shows voltage, current, active power and reactive power
harmonic components both in percent of the fundamental and in natural units, and
harmonic phase angles.
To change a phase, click on the window with the right mouse button, select
“Options...”, check the phase you want displayed, and then click OK.