Viewing an rms plot, Viewing a frequency plot, Viewing a spectrum chart – SATEC PM180 Operation Manual User Manual
Page 145
Chapter 14 Viewing Log Files
Viewing Waveforms
PM180 Substation Automation Unit
143
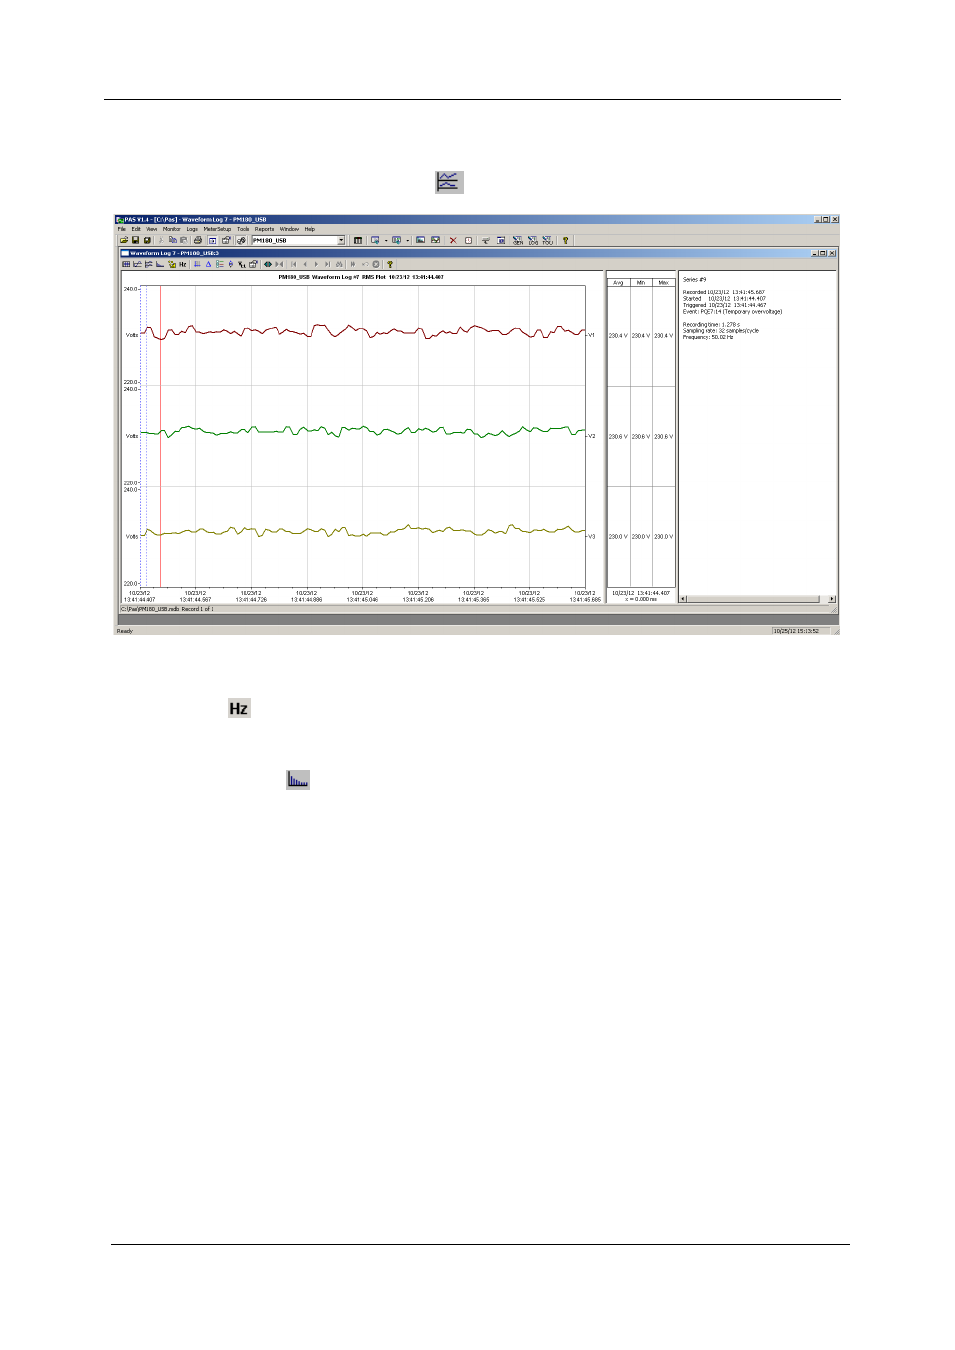
Viewing an RMS Plot
PAS can show you a cycle-by-cycle RMS plot of the sampled AC waveforms. To
open the RMS view, click on the
button. The graph shows the RMS points
updated each half cycle.
Viewing a Frequency Plot
To view a cycle-by-cycle frequency plot of the sampled voltage waveforms, click on
the
button.
Viewing a Spectrum Chart
Click on the
button to view a spectrum chart for the selected waveform channel.
To change a channel, click on the window with the right mouse button, select
“Channels...”, check the channel you want displayed, and then click OK. PAS
provides voltage, current, active power and reactive power spectrum charts.
A spectrum is calculated over four cycles of the waveform beginning from the point
where the left marker line is located in the open waveform view. If both waveform
views are open, PAS gives the priority to the overlapped waveform view.