Viewing waveforms – SATEC PM180 Operation Manual User Manual
Page 143
Chapter 14 Viewing Log Files
Viewing Waveforms
PM180 Substation Automation Unit
141
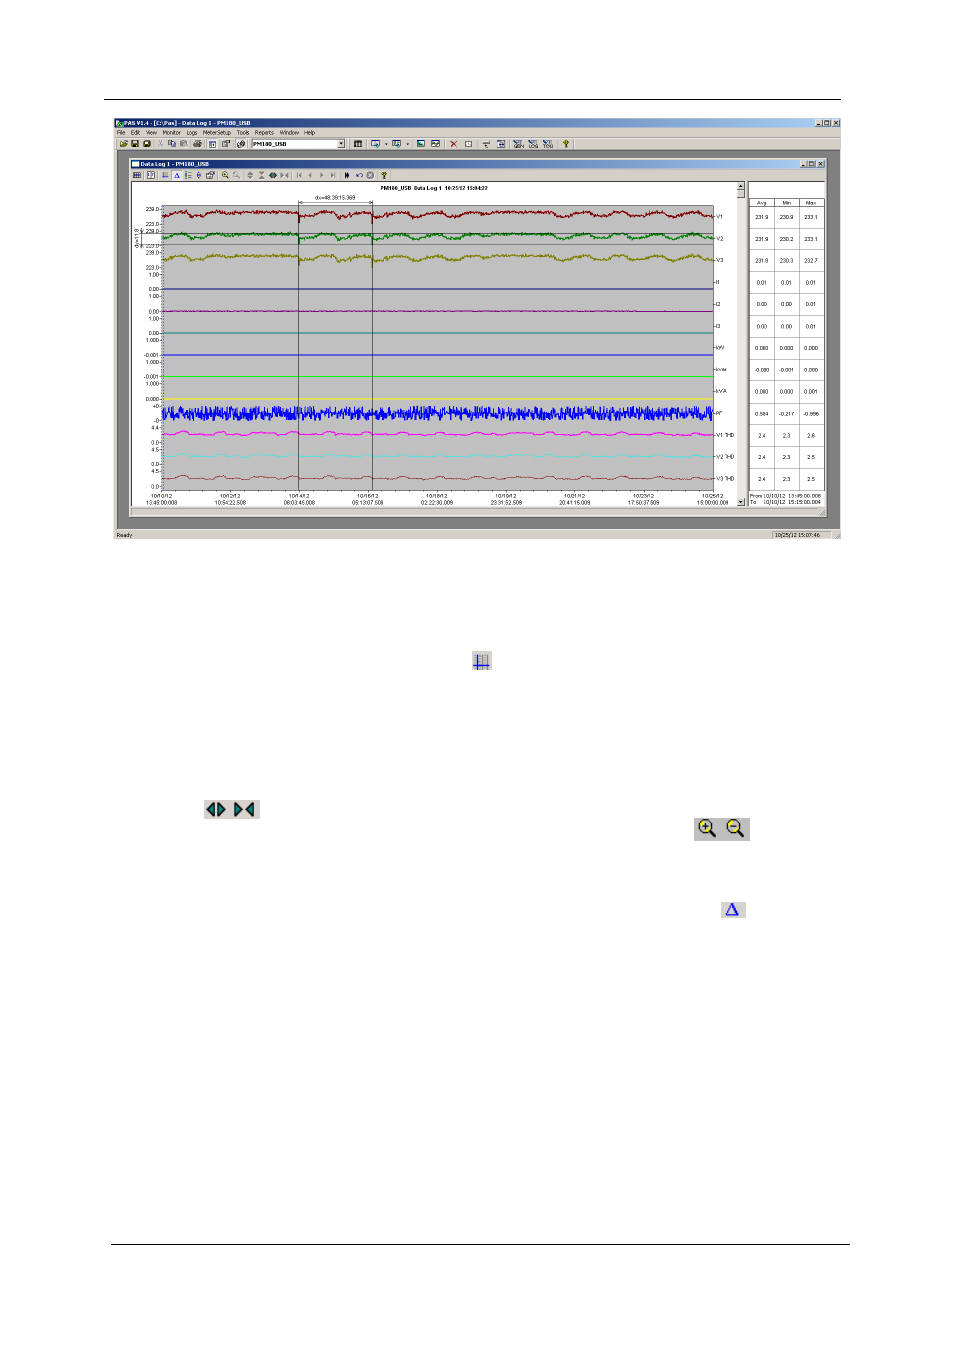
Using the Marker Lines
The trend window has two blue dashed marker lines. The left marker indicates the
starting position and the right marker indicates the end position for calculating the
average and peak values.
To change the marker position, click on the trend window with the right mouse
button, select Set Marker, or click on the
button on the window toolbar, and then
click with left mouse button on the point where you want to put the marker. You can
also drag both markers with the mouse, or use the right and left arrow keys on your
keyboard to change the marker position (click on the trend pane with the mouse
before using the keyboard, to allow the keyboard to receive your input).
Using a Zoom
You can use a horizontal and a vertical zoom to change size of your graph. Use the
buttons on you local toolbar representing green arrowheads to zoom in and
zoom out. One click gives you a 100-percent horizontal zoom. Two buttons
representing magnifying glasses give you a proportional zoom in both directions.
Delta Measurements
To measure the distance between two trend points, click on the Delta button
,
then click on the first point, and then click on the second point. The first reference
point is still frozen until you close and reopen Delta, while the second point can be
placed anywhere within the trend line. You can measure a delta in both directions. To
disable delta measurements, click on the Delta button once again.
Viewing Waveforms
Waveform data can be displayed in five different views. When you open a new file,
PAS shows you a waveform graph showing non-overlapped waveforms. Each
waveform window has a local toolbar from where you can open another window to
examine the waveform in a different view.