Viewing data trend – SATEC PM180 Operation Manual User Manual
Page 124
Chapter 12 Monitoring Devices
Viewing Real-time Data
122
PM180 Substation Automation Unit
Selecting Primary and Secondary Units
Voltages and currents can be displayed in primary or secondary units. To select
primary or secondary units for your data views, click on the monitor window with the
right mouse button, select Options, select the desired units for voltages and currents,
and then click OK.
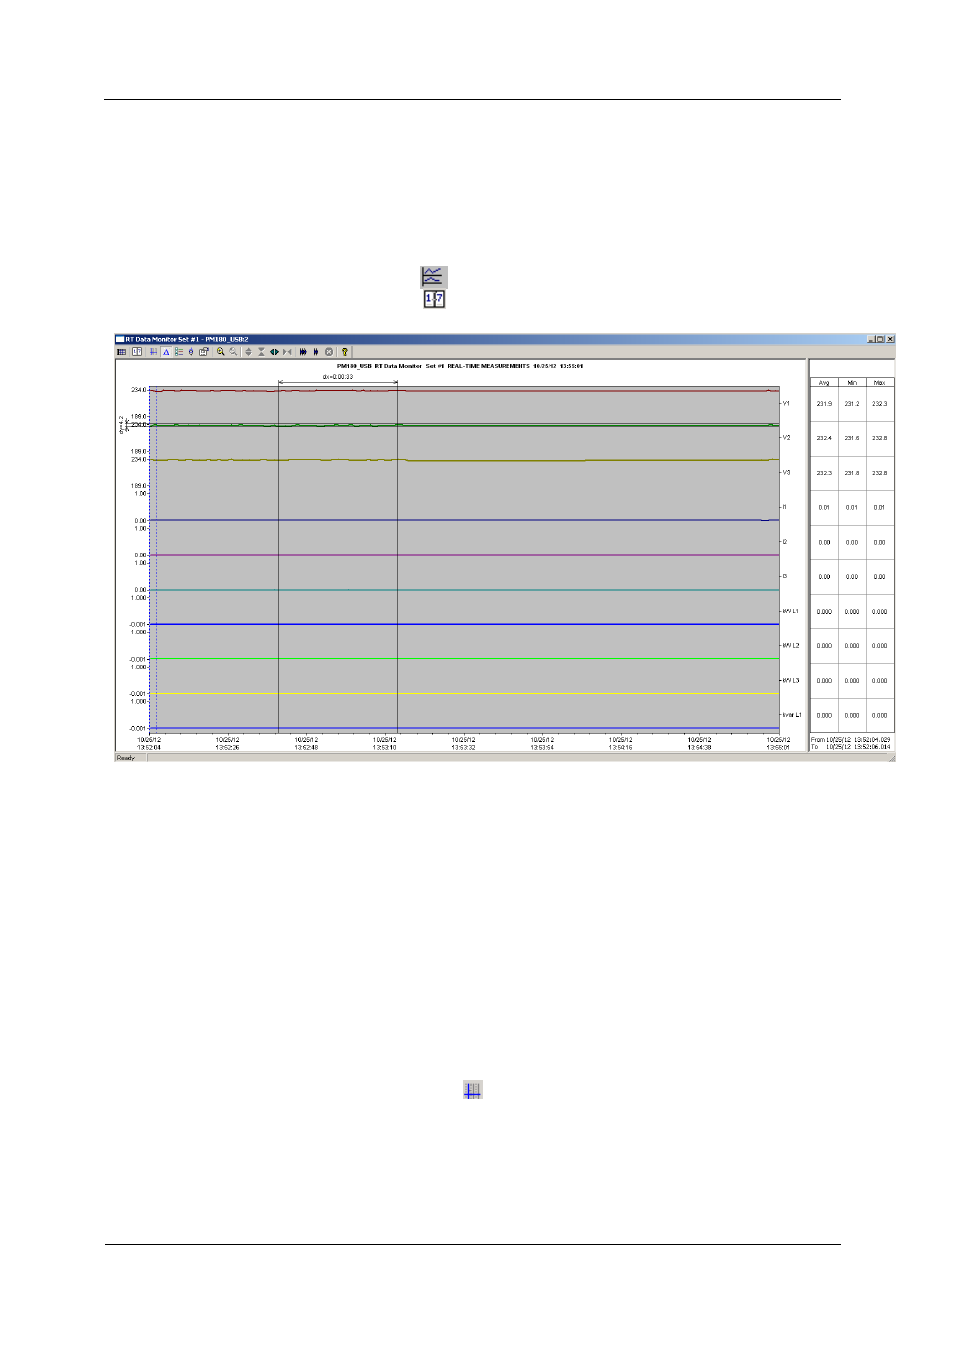
Viewing Data Trend
To view a data trend, click on the
button on the local toolbar. To change the time
range for your graph, click on the
button on the local toolbar, and then select the
desired date and time range.
Selecting Channels
To select data channels for your trend, click on the trend window with the right mouse
button, sele
ct “Channels”, check the channels you want displayed, and then click OK.
Customizing Line Colors and Styles
Trend lines for different channels can be shown in different colors using different line
styles. To change the colors or line styles, click on the trend window with the right
mouse button, select “Options...”, click on the “Display” tab, adjust colors and styles
for channels, and then click OK. You can also change the colors for the background
and gridlines.
Using the Marker Lines
The trend window has two blue dashed marker lines. The left marker indicates the
starting position for calculating the average and peak values, and the right marker
indicates the end position.
To change the marker position, click on the trend window with the right mouse button
and select Set Marker, or click on the
button on the window toolbar, and then
click with left mouse button on the point where you want to put the marker. You can
also drag both markers with the mouse, or use the right and left arrow keys on your
keyboard to change the marker position. Click on the trend pane with the mouse
before using the keyboard, to allow the keyboard to get your input.