Viewing data trend – SATEC PM180 Operation Manual User Manual
Page 142
Chapter 14 Viewing Log Files
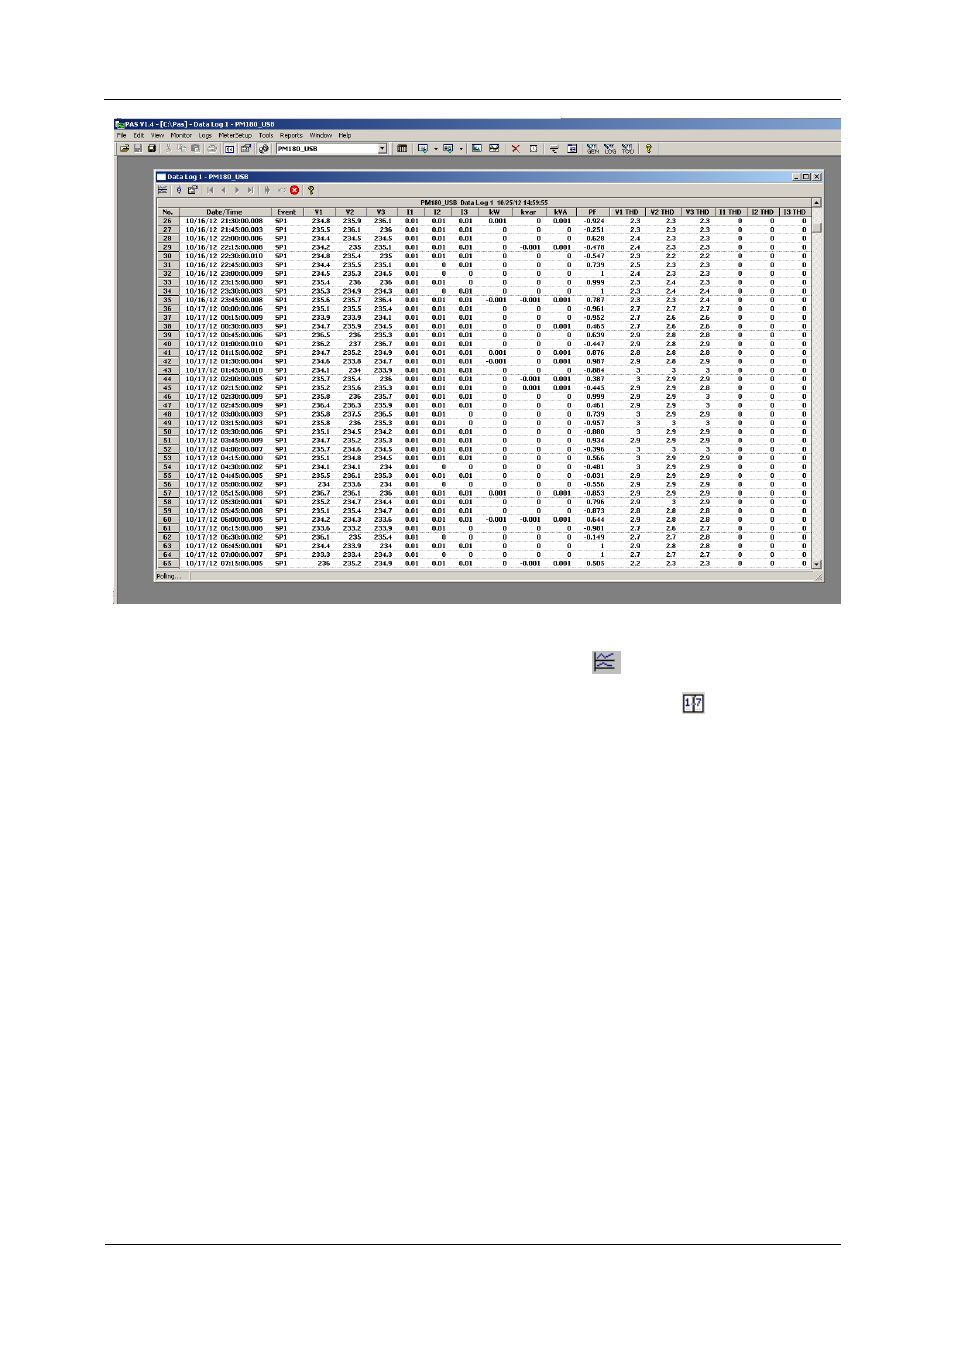
Viewing the Data Log
140
PM180 Substation Automation Unit
Viewing Data Trend
To view data in a graphical form, click on the Data Trend
button on the local
toolbar.
To change the time range for your graph, click on the Time Range button
on the
local toolbar, and then select the desired date and time range.
Selecting Channels
To select desired data channels for your trend, click on the trend window with the
right mouse button, select “Channels”, check the channels you want displayed, and
then click OK.
Customizing Line Colors and Styles
Trend lines for different channels can be shown in different colors using different line
styles. To change the colors or line styles, click on the trend window with the right
mouse button, select “Options...”, click on the “Display” tab, adjust colors and styles
for channels, and then click OK. You can also change the colors for the background
and gridlines.