Viewing the data log – SATEC PM180 Operation Manual User Manual
Page 141
Chapter 14 Viewing Log Files
Viewing the Data Log
PM180 Substation Automation Unit
139
To change the sorting order, click on the Sort button
, or click on the report
window with the right
mouse button and select “Sort...”, check a desired sort order,
and then click OK.
Selecting Primary and Secondary Units
Voltages and currents can be displayed in primary or secondary units. To select units
for your data views, click on the report window with the right mouse button, select
Options, select the desired units for voltages and currents, and then click OK.
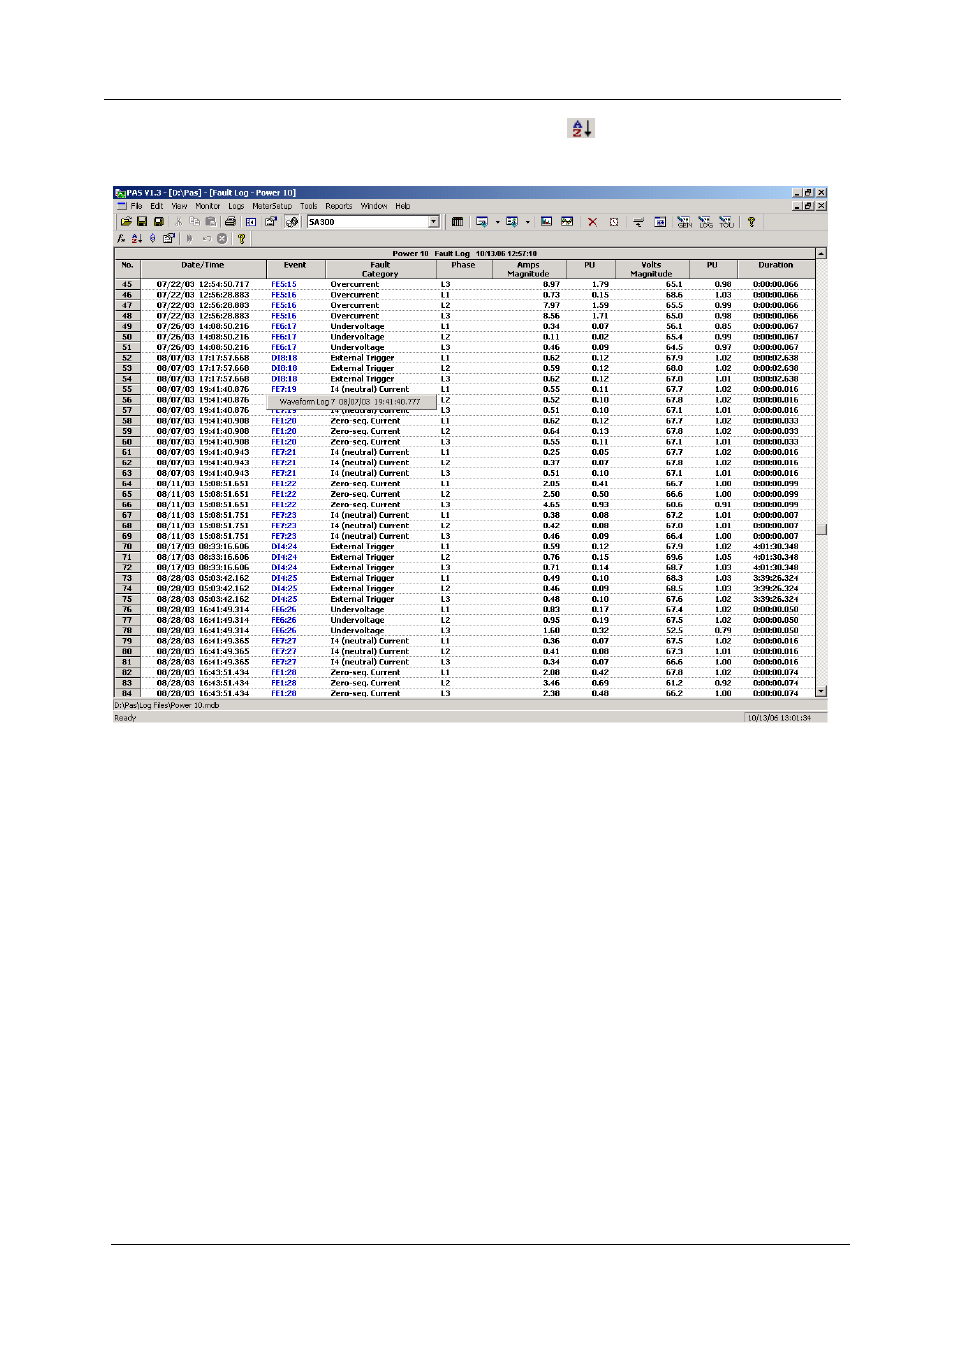
Linking to Waveforms and Data Records
When displaying the fault report, PAS establishes links between the event and
related waveforms and data log records. Fault events for which PAS finds related
links are blue colored.
Click on the colored event ID with the left mouse button to check a list of the event
links. Click on a list item to move to the related waveform or data log records. Data
log records associated with the fault event are taken into a separate window for easy
viewing and trending.
Viewing the Data Log
Data log files can be displayed in a tabular view, one data record per row, or in a
graphical view as a data trend graph.