Viewing an rms plot, Viewing a frequency plot, Viewing a spectrum chart – SATEC SA300 ezPAC Operation Manual User Manual
Page 147
Chapter 14 Viewing Log Files
Viewing Waveforms
SA300 Substation Automation Unit
147
You can open all five views together to analyze different properties of the waveform
like a wave shape, waveform disturbance, unbalance, or spectrum. When you move
to another waveform record, all views are updated simultaneously to reflect the
changes.
To view overlapped waveforms, click on the
button on the local toolbar; to view
non-overlapped waveforms, click on the
button.
Waveform data is recorded in series that may contain many cycles of the sampled
waveform. A waveform window displays up to 128 waveform cycles. If the waveform
contains more cycles, the scroll bar appears under the waveform pane allowing you
to scroll through the entire waveform.
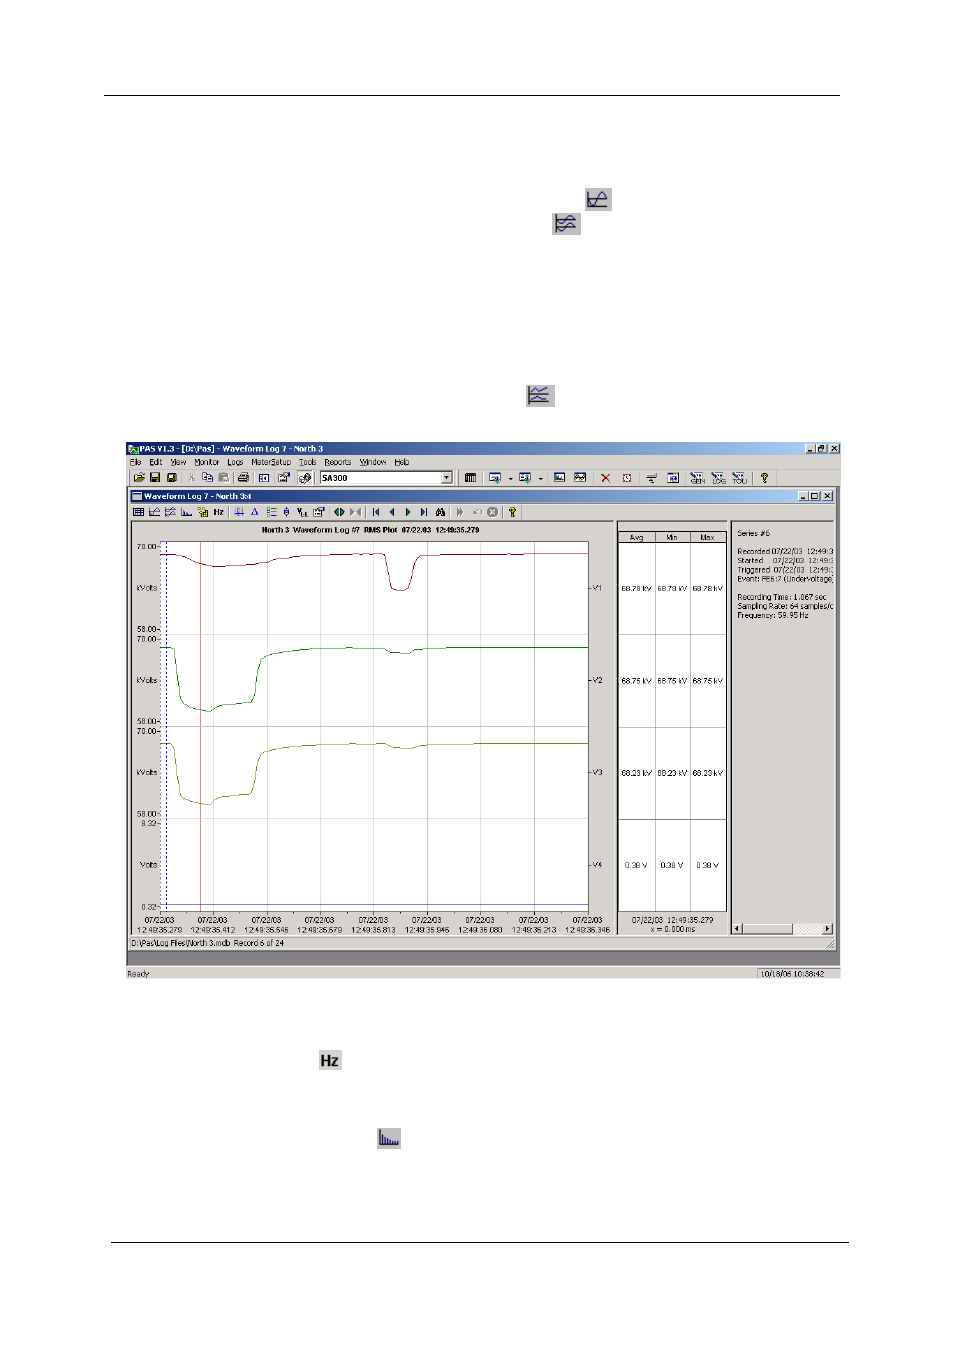
Viewing an RMS Plot
PAS can show you a cycle-by-cycle RMS plot of the sampled AC waveforms. To
open the RMS view, click on the
button. The graph shows the RMS points
updated each half cycle.
Viewing a Frequency Plot
To view a cycle-by-cycle frequency plot of the sampled voltage waveforms, click on
the
button.
Viewing a Spectrum Chart
Click on the
button to view a spectrum chart for the selected waveform channel.
To change a channel, click on the window with the right mouse button, select
“Channels...”, check the channel you want displayed, and then click OK. PAS
provides voltage, current, active power and reactive power spectrum charts.