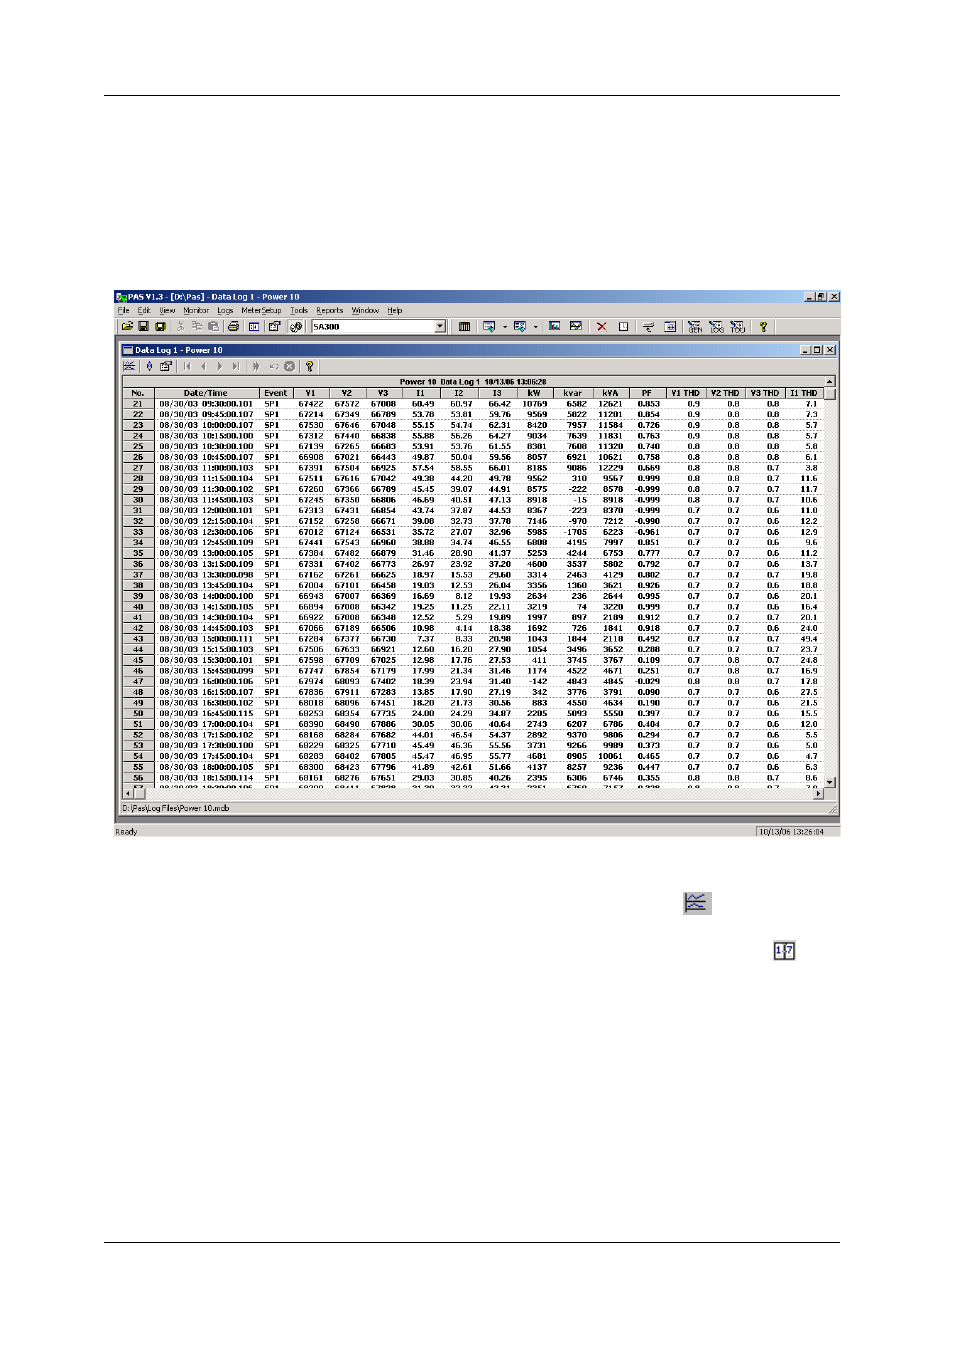
Viewing the data log, Viewing data trend, Selecting channels – SATEC SA300 ezPAC Operation Manual User Manual
Page 144: Customizing line colors and styles

Chapter 14 Viewing Log Files
Viewing the Data Log
144
SA300 Substation Automation Unit
Click on the colored event ID with the left mouse button to check a list of the event
links. Click on a list item to move to the related waveform or data log records. Data
log records associated with the fault event are taken into a separate window for easy
viewing and trending.
Viewing the Data Log
Data log files can be displayed in a tabular view, one data record per row, or in a
graphical view as a data trend graph.
Viewing Data Trend
To view data in a graphical form, click on the Data Trend
button on the local
toolbar.
To change the time range for your graph, click on the Time Range button
on the
local toolbar, and then select the desired date and time range.
Selecting Channels
To select desired data channels for your trend, click on the trend window with the
right mouse button, select “Channels”, check the channels you want displayed, and
then click OK.
Customizing Line Colors and Styles
Trend lines for different channels can be shown in different colors using different line
styles. To change the colors or line styles, click on the trend window with the right
mouse button, select “Options...”, click on the “Display” tab, adjust colors and styles
for channels, and then click OK. You can also change the colors for the background
and gridlines.
