Viewing the iti (cbema) curve, Viewing the ieee 1159 statistics report – SATEC SA300 ezPAC Operation Manual User Manual
Page 138
Chapter 14 Viewing Log Files
Viewing the IEEE 1159 Statistics Report
138
SA300 Substation Automation Unit
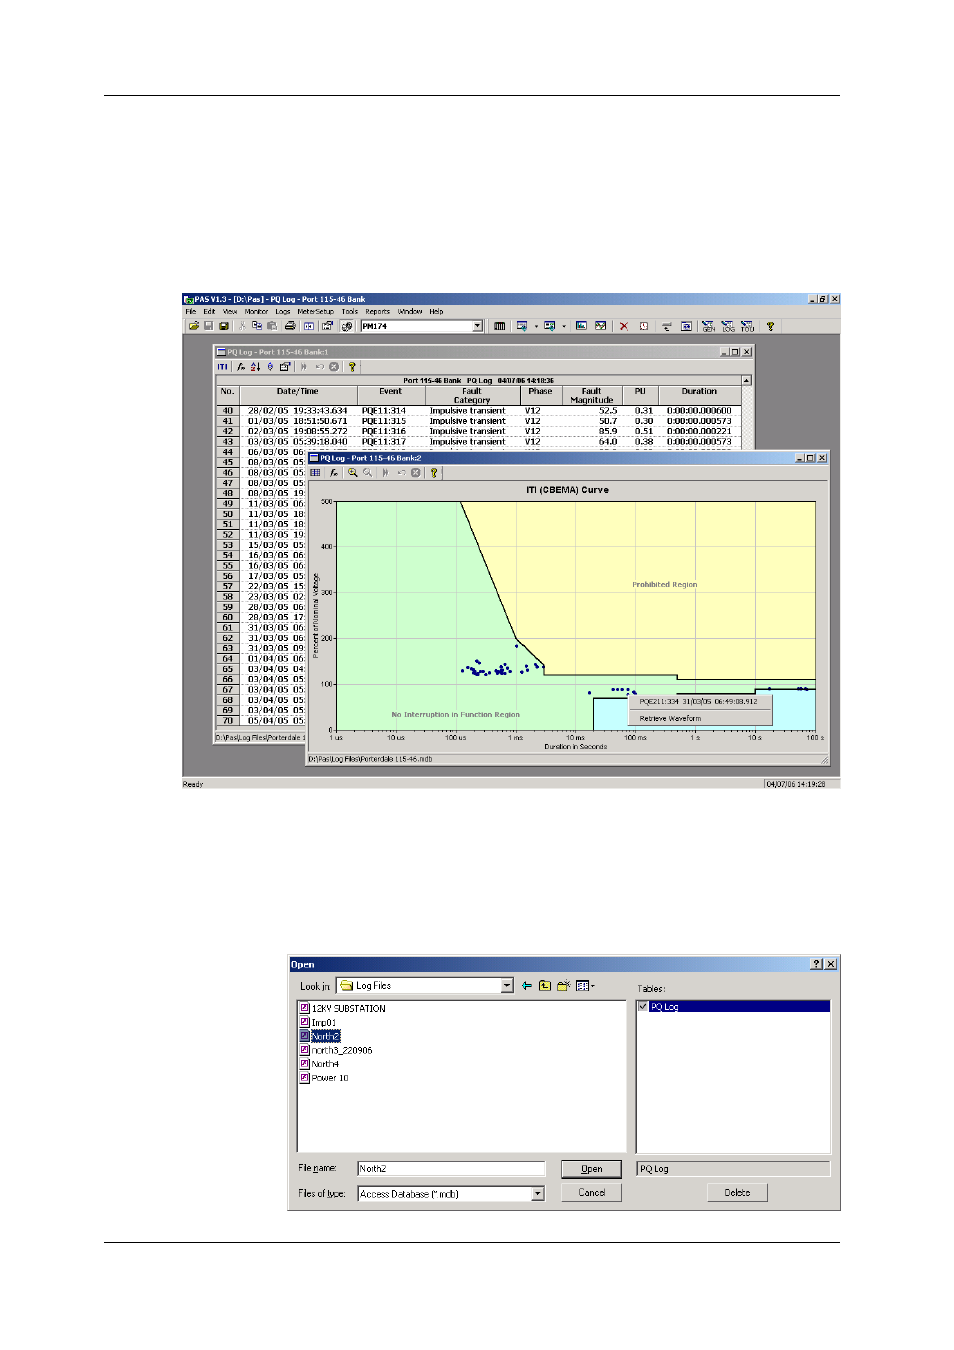
Viewing the ITI (CBEMA) Curve
Impulsive transients and short-duration voltage variations (sags and swells) can be
viewed as magnitude/duration pairs on the ITIC (the Information Technology Industry
Council, formerly CBEMA) curve chart. To view an ITI curve chart, click on the “ITI”
button on the window toolbar.
To view the event details, click on the event point with the left mouse button. To
directly move to the related power quality report entry or to a waveform record, click
on the corresponding list item with the left mouse button.
Viewing the IEEE 1159 Statistics Report
PAS can generate IEEE 1159 statistics reports on the collected power quality event
data.
To get an IEEE 1159 statistics report, select “IEEE 1159 Statistics” from the Reports
menu, point to the database where you stored the retrieved power quality log data,
and then click Open.