Selecting the time range, Customizing reports, Viewing the en50160 online statistics report – SATEC SA300 ezPAC Operation Manual User Manual
Page 142: Viewing the en50160 harmonics survey report, Viewing the fault log, Filtering and sorting events
Chapter 14 Viewing Log Files
Viewing the Fault Log
142
SA300 Substation Automation Unit
For characteristics provided with definite limits, the report shows a percentage of the
observation time within which the characteristic complied with the standard, e.g. 98%
of the observations in a period of one week, and the total compliance indicator.
For voltage characteristics provided with indicative values, the report gives the yearly
statistical data classified by voltage magnitude and duration.
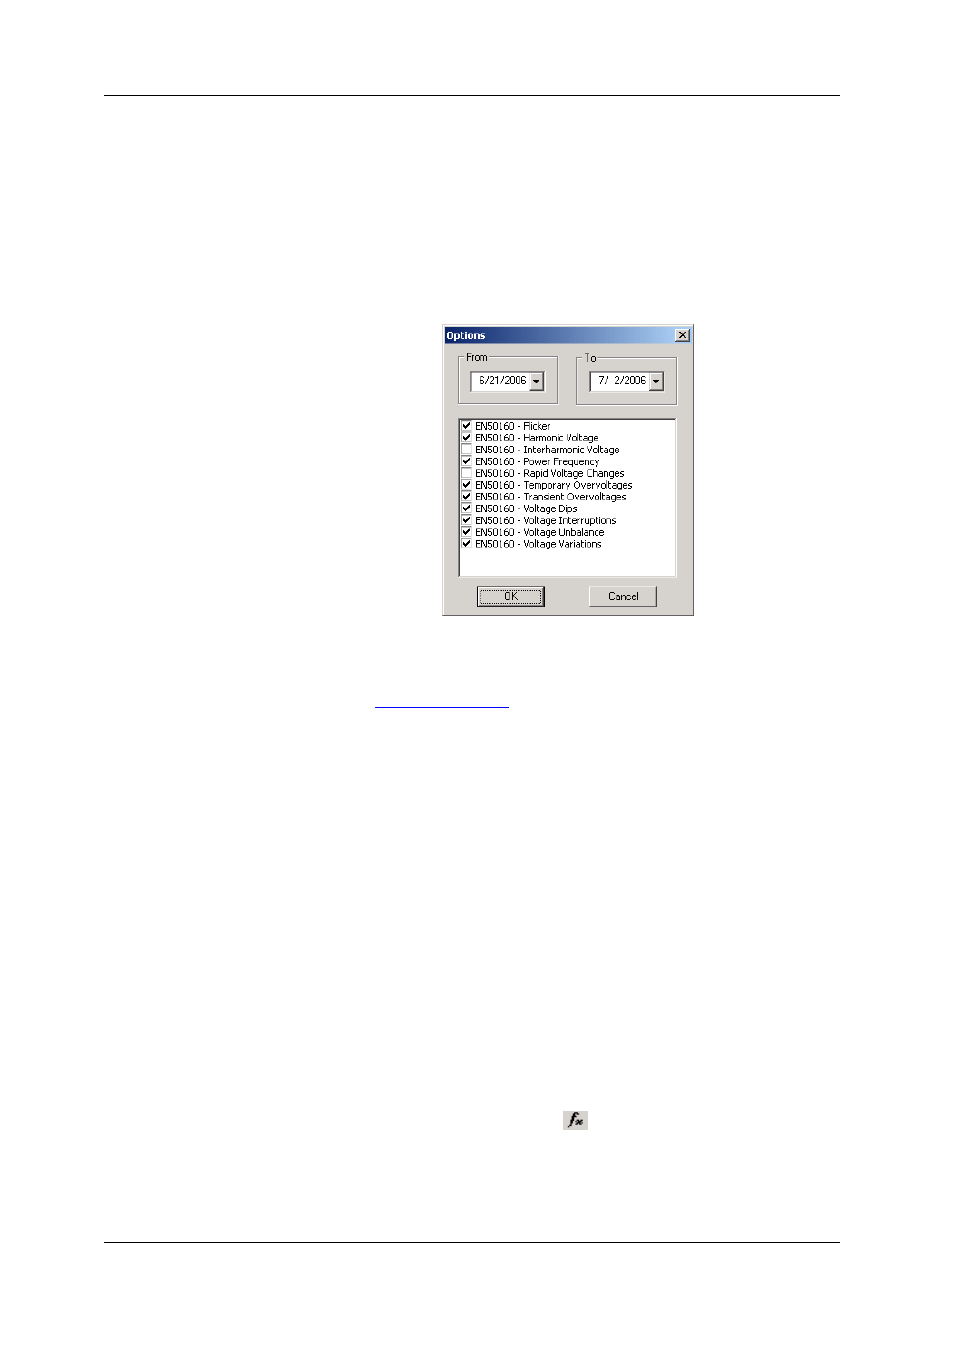
Selecting the Time Range
To change the time range or contents of the report, click on the report with the right
mouse button, select “Options…”, select the required time range, check the voltage
characteristics to be included in the report, and then click OK.
Customizing Reports
For information on how to add a logo image, the header and the footer to your
Viewing the EN50160 Online Statistics Report
If you retrieved the EN50160 online statistics data, you can view the online report on
the last retrieved statistics in the same manner as the EN50160 Compliance statistics
report. Select “EN50160 Online Statistics” from the Reports menu, point to the
database where you stored the retrieved online statistics, uncheck the voltage
characteristics’ tables that you do not want to be reported, and then click Open.
Viewing the EN50160 Harmonics Survey Report
To view the EN50160 harmonics survey report on the collected statistics data, select
“EN50160 Harmonics Survey” from the Reports menu, point to the database where
you stored the retrieved statistics, uncheck the voltage channels which you do not
want to be reported, and then click Open.
Viewing the Fault Log
Fault log files are displayed in a tabular view. PAS loads the entire database table to
a window, so that you can scroll through the entire log to view its contents.
Filtering and Sorting Events
To filter events, click on the Filter button
, or click on the report window with the
right mouse button and select “Filter...”, check the categories of events you want to
display, and then click OK.