Changing the report time range and contents, Viewing the iti (cbema) curve, Viewing the ieee 1159 statistics report – SATEC SA300 ezPAC Operation Manual User Manual
Page 139
Chapter 14 Viewing Log Files
Viewing the IEEE 1159 Statistics Report
SA300 Substation Automation Unit
139
The IEEE 1159 statistics is reported within the selected time range on either a
weekly, or yearly basis.
Statistics of power quality incidents for voltage imbalance, harmonics, flicker and
frequency variations are given on a per week basis. The report shows the number of
incidents, and a total time and a percentage of the observation time within which the
characteristic exceeds the standard limit.
For voltage transients, sags, swells and interruptions, the report gives the yearly
statistical data classified by voltage magnitude and duration.
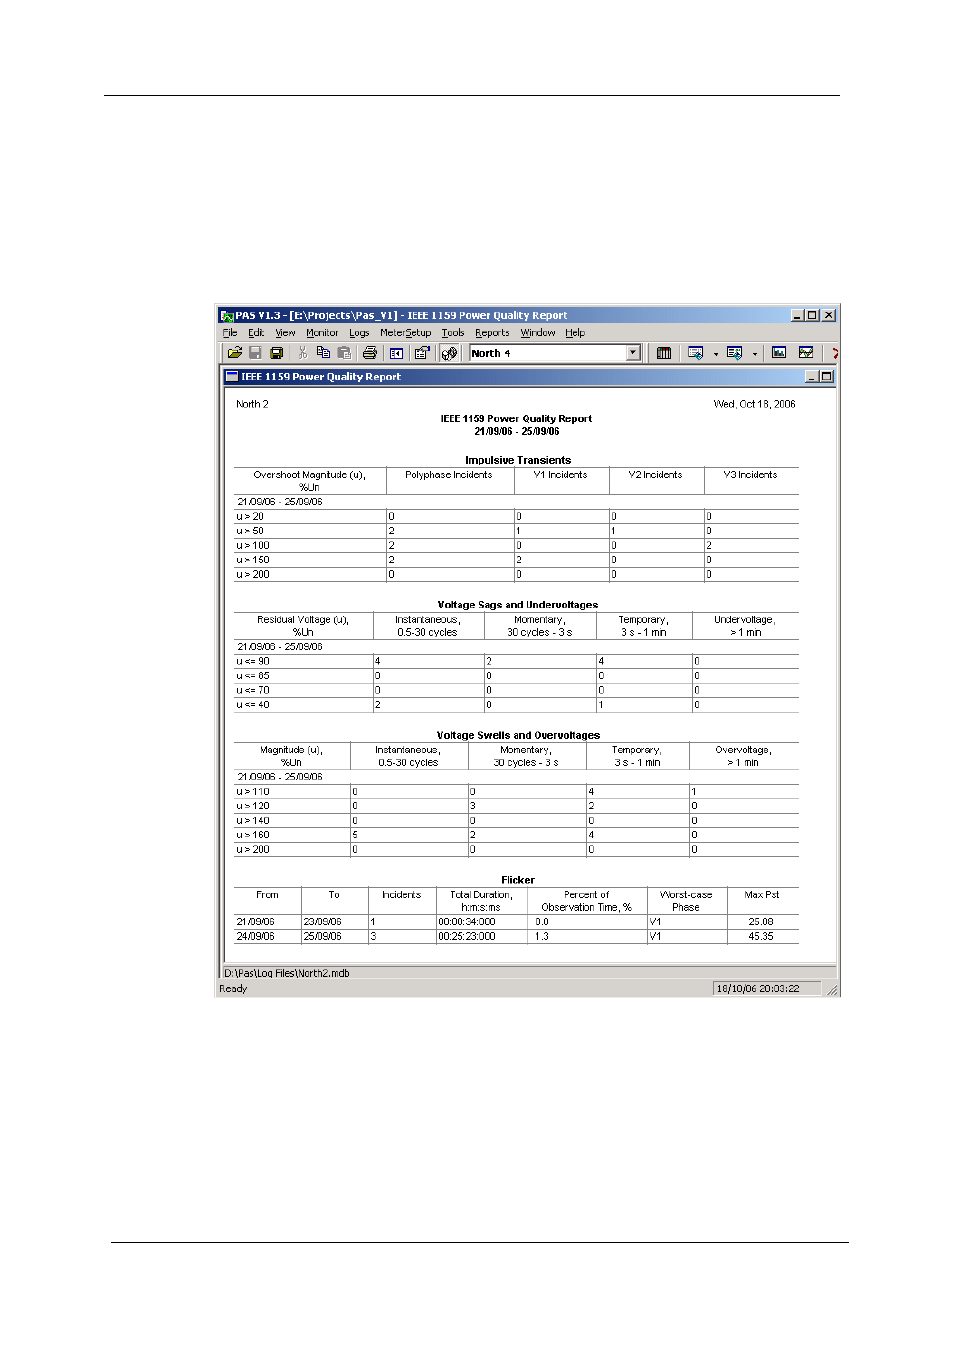
An example of the IEEE 1159 statistics report is shown in the following picture.
Changing the Report Time Range and Contents
Click on the report with the right mouse button, select “Options…”, select the required
time range, check the voltage characteristics to be included in the report, and then
click OK.