Viewing a data table, Changing the data view, Selecting primary and secondary units – SATEC SA300 ezPAC Operation Manual User Manual
Page 125: Viewing data trend
Chapter 12 Monitoring Devices
Viewing Real-time Data
SA300 Substation Automation Unit
125
Viewing a Data Table
Changing the Data View
PAS displays data in either a single record or multi-record view. To change the view,
click on the Data Monitor window with the right mouse button and select either Wrap
to see a single record, or UnWrap to go to the multi-record view.
Adjusting the Number of Rows in a Multi-Record View
Click the window with the right mouse button, select Options, adjust the number of
records you want to see in the window, and then click OK. When the number of
retrieved records exceeds the number of rows in the window, the window scrolls up
so that older records are erased.
Selecting Primary and Secondary Units
Voltages and currents can be displayed in primary or secondary units. To select
primary or secondary units for your data views, click on the monitor window with the
right mouse button, select Options, select the desired units for voltages and currents,
and then click OK.
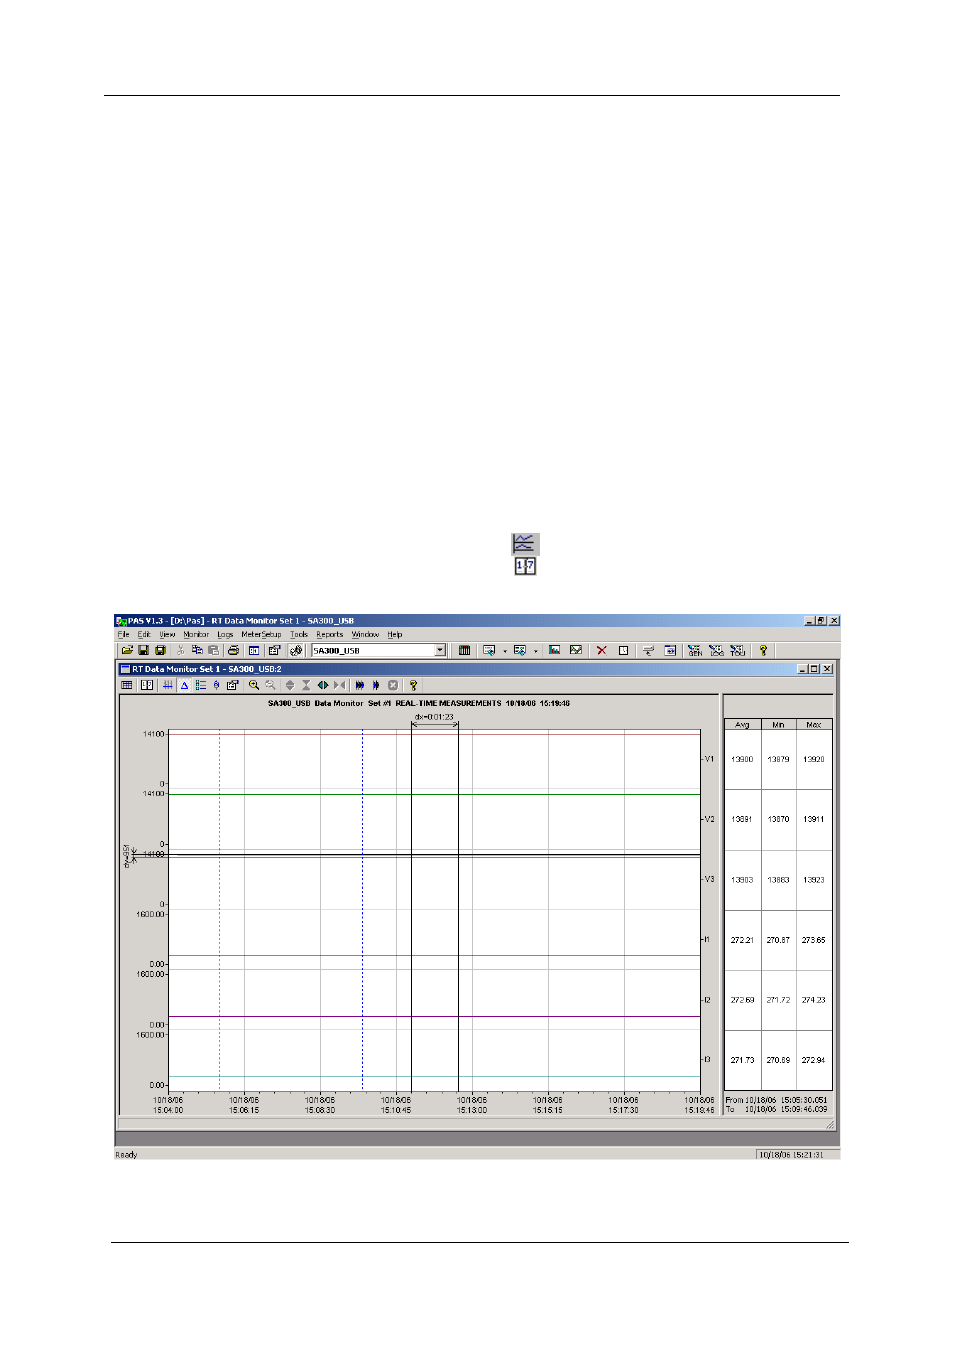
Viewing Data Trend
To view a data trend, click on the
button on the local toolbar. To change the time
range for your graph, click on the
button on the local toolbar, and then select the
desired date and time range.