Depth settings, Land settings, Chart settings – Seiwa SW701i SW701e User Manual
Page 56: Underwater objects settings
58
User Manual
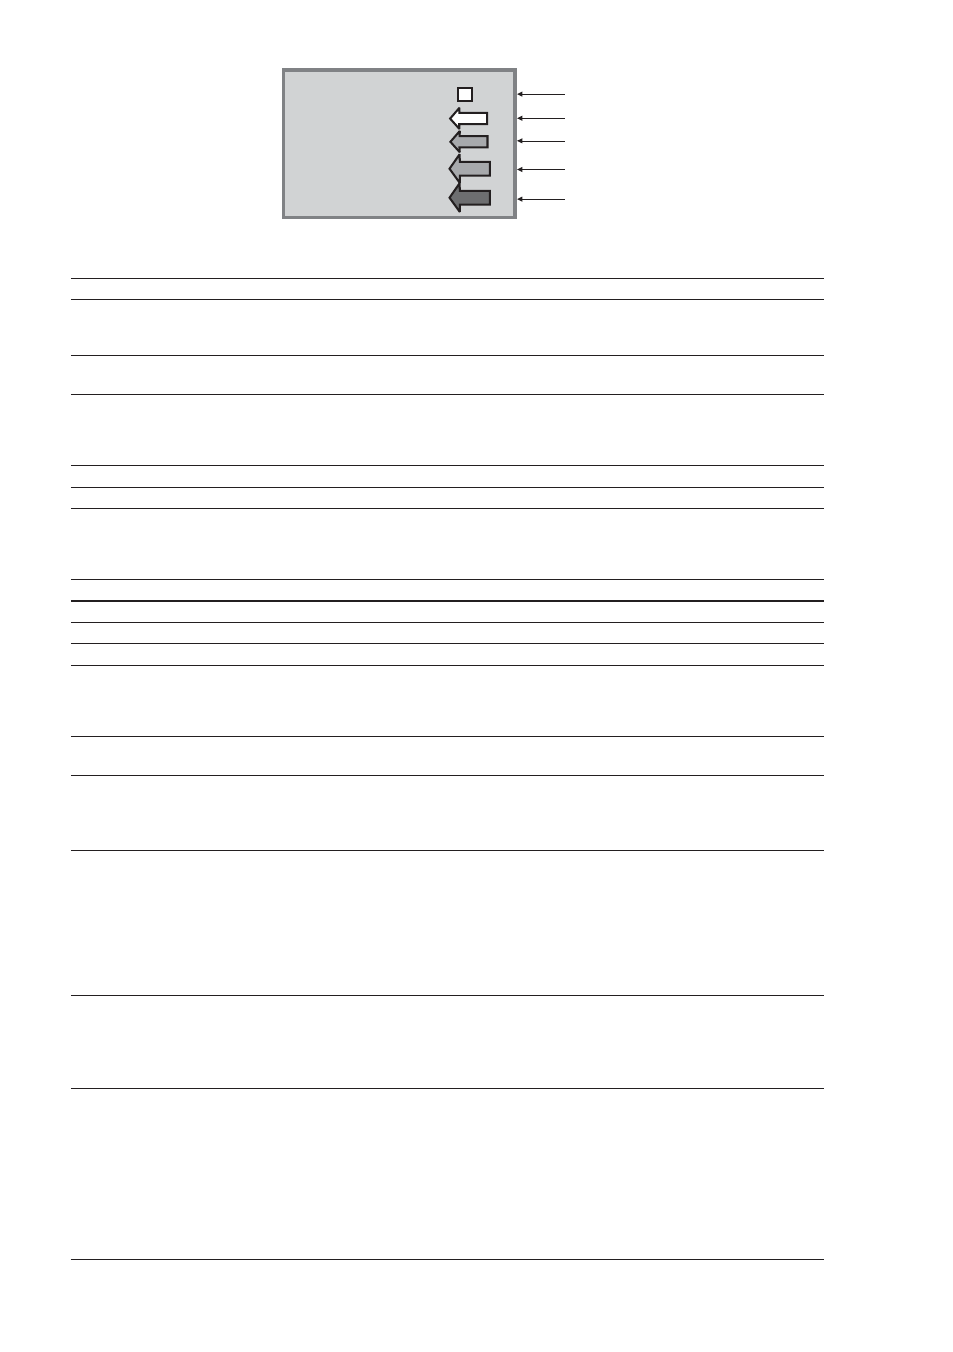
0 to 0.1 kn
-
0.2 to 1.0 kn -
1.1 to 2.0 kn -
2.1 to 3.0 kn -
3.1 to 9.9 kn -
Yellow
Yellow
Orange
Orange
Red
When the chart plotter receives a valid position fix, the Tide icons are shown on the
charts on the basis of the current date and time: the screen displays and changes arrows
as date/time changes.
Seabed Type
: Sets On/Off the displaying of the Seabed Type.
Ports & Services
: Sets On/Off the displaying of the Ports and Services (areas along shore with facilities for
mooring, downloading and uploading of ships, generally sheltered from waves and winds.
Port installations are piers, wharves, pontoons, dry docks, cranes...).
Tracks & Routes
: Sets On/Off the displaying of the Tracks and Routes (recommended and established
routes for ships at sea, including traffic separation schemes, deep water routes).
Depth Settings
To control the display on the map of the depth informations.
Depth Range Min
: Sets a minimum reference for the Depth Areas. The default setting is 0 Mt.
Depth Range Max
: Sets a maximum reference for the Depth Areas. The default setting is 9.999 Mt.
Land Settings
To control the display on the map of the terrestrial features.
Land Elevations
: Sets On/Off the Land Elevation display.
Land Elevations Values : Sets On/Off the displaying of the Land Elevations Values.
Roads
: Sets On/Off the displaying of the Roads.
POIs
: Sets On/Off the displaying of Points Of Interest.
Chart Settings
To control the display on the map of the chart features.
Lat/Lon Grid
: Sets On/Off the displaying of the grid of parallels (of Latitude) and meridians (of Longitude) drawn
on the map.
Chart Boundaries : Sets On/Off the displaying of the Chart Boundaries, which represents the boundaries of the charts
available on the chart plotter. Selecting Auto instead, if we are in background charts only the first
chart levels contained in the DATA MEDIA are displayed, if we are in a charts level contained in
the DATA MEDIA the next four charts level are displayed.
Value-Added Data : Sets On/Off the displaying of the Value Added Data (VAD), a collection of additional cartographic
objects which are not present on the original paper chart (from which the electronic chart derives)..
These objects have been obtained from other sources and then merged to the electronic charts
in order to provide more information useful for the navigation. VAD object can be any cartographic
objects and it can be distinguished from the official-chart-objects from the Quick Info. A dedicated
icon is shown on the Quick Info window to indicate that the object queried is a VAD. The same
icon is also shown on the Full Info page and in addition the extended text Value Added Data is
shown on the details of the VAD object.
Chart Lock (*)
: Sets On/Off the Chart Lock option. When Chart Lock is On, the available zoom scales are only
the ones containing cartographic data. Instead when Chart Lock is Off, it is possible to zoom down
into zoom scales not covered by cartographic data after the last available zoom scale covered by
cartographic data. The DSI window, if present, will show “NO CHART”, when an empty level is
entered in the location of map expansion mode.
NOTE* When an empty level is entered, the message “No cartographic coverage” is
shown on a window in a corner of the map display. The warning message is
always displayed as long as the current zoom has no data coverage.
Underwater Objects Settings
To control the display on the Underwater Objects.