Mixing levels, Safety status bar (dsi = d – Seiwa SW701i SW701e User Manual
Page 53
55
User Manual
Mixing Levels
[MENU] + "Map Options" + [ENTER] + "Mixing Levels" + [ENTER]
When the map coverage at the current zoom level does not fill the entire screen,
the chart plotter draws the rest of the map expanding the cartographic informa-
tion read from, at most, two zoom levels above the current zoom level. For this
reason the map is drawn three times: firstly it draws the two levels before the
current level and then the current level. The area covered by the cartographic
data read from the previous levels is identified by a dotted pattern. When the
cursor is moved on an area not covered by data of the current level the chart
plotter zooms out to the first level covered by cartographic data.
NOTE
The Mixing Levels function affects the speed of the redraw of the screen. If
this function is not used it may be disabled.
Safety Status Bar (DSI = D
ATA
S
AFETY
I
NDICATOR
)
[MENU] + "Map Options" + [ENTER] + "Safety Status Bar" + [ENTER]
The possible choices are listed in the table below:
On
: The Safety Status Bar is shown.
Off
: The Safety Status Bar is not shown.
Icon
: The Safety Status Bar is not shown, but a Warning alarm Icon is shown in the bottom right corner
of the display when an item controlled by the DSI (Data Safety Indicator) is under an alarm
condition. The Warning Icon remains displayed until the alarm condition persists. By placing the
cursor over this Icon, a quick help message is shown next to the Icon, allowing to show the Safety
Status Bar. In this case - when the Safety Status Bar is opened via Warning alarm Icon - it is
possible to obtain information about each “active” Safety Status box (the red ones): it is possible
to select them by cursor movement left/right, and a list of active alarms is shown underneath the
selected box. By pressing [CLEAR], the Safety Status Bar is removed from the screen.
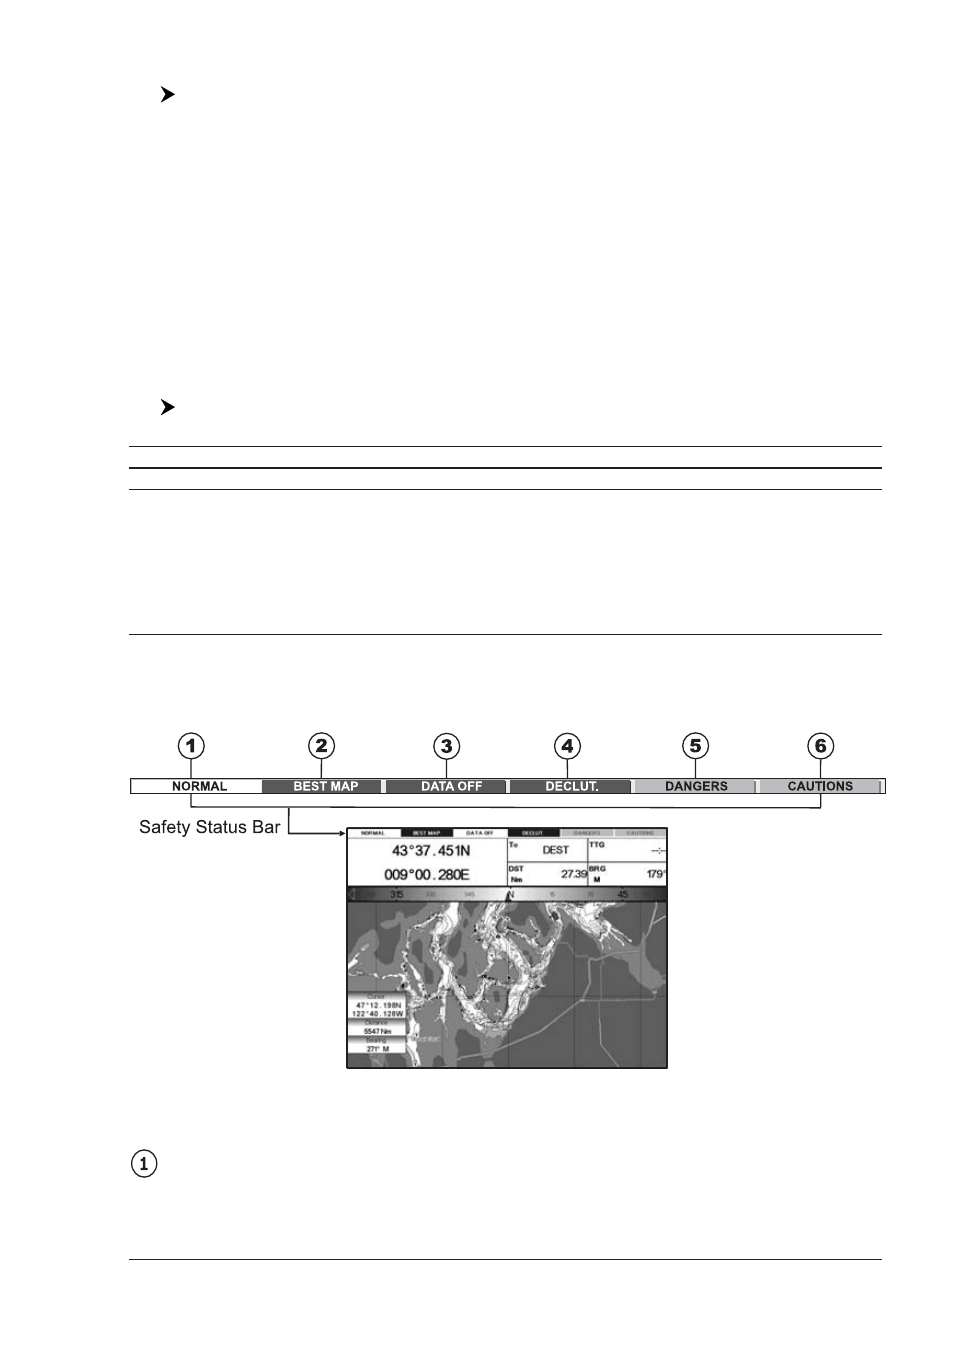
When Safety Status Bar is On, a status bar with six boxes showing the status of
certain functions is displayed. Any warning or alarm condition is identified by the
red color to indicate possible risk.
Fig. 3.2b - Safety Status Bar
Boxes definition is as follows:
Zoom
♦
Normal: when the chart is displayed at normal scale.