Stopping real-time performance data collection – HP XP P9000 Performance Advisor Software User Manual
Page 325

7.
From the Choose Metrics list, select the check boxes for the real-time metrics of your choice.
For more information on the real-time metrics, see
“Real-time metrics and descriptions”
.
8.
Click Start Plotting.
HP XP P9000 Performance Advisor plots the performance graphs in the Chart Work Area as
and when the real-time performance data is collected for the selected components. For more
information on using charts, see
.
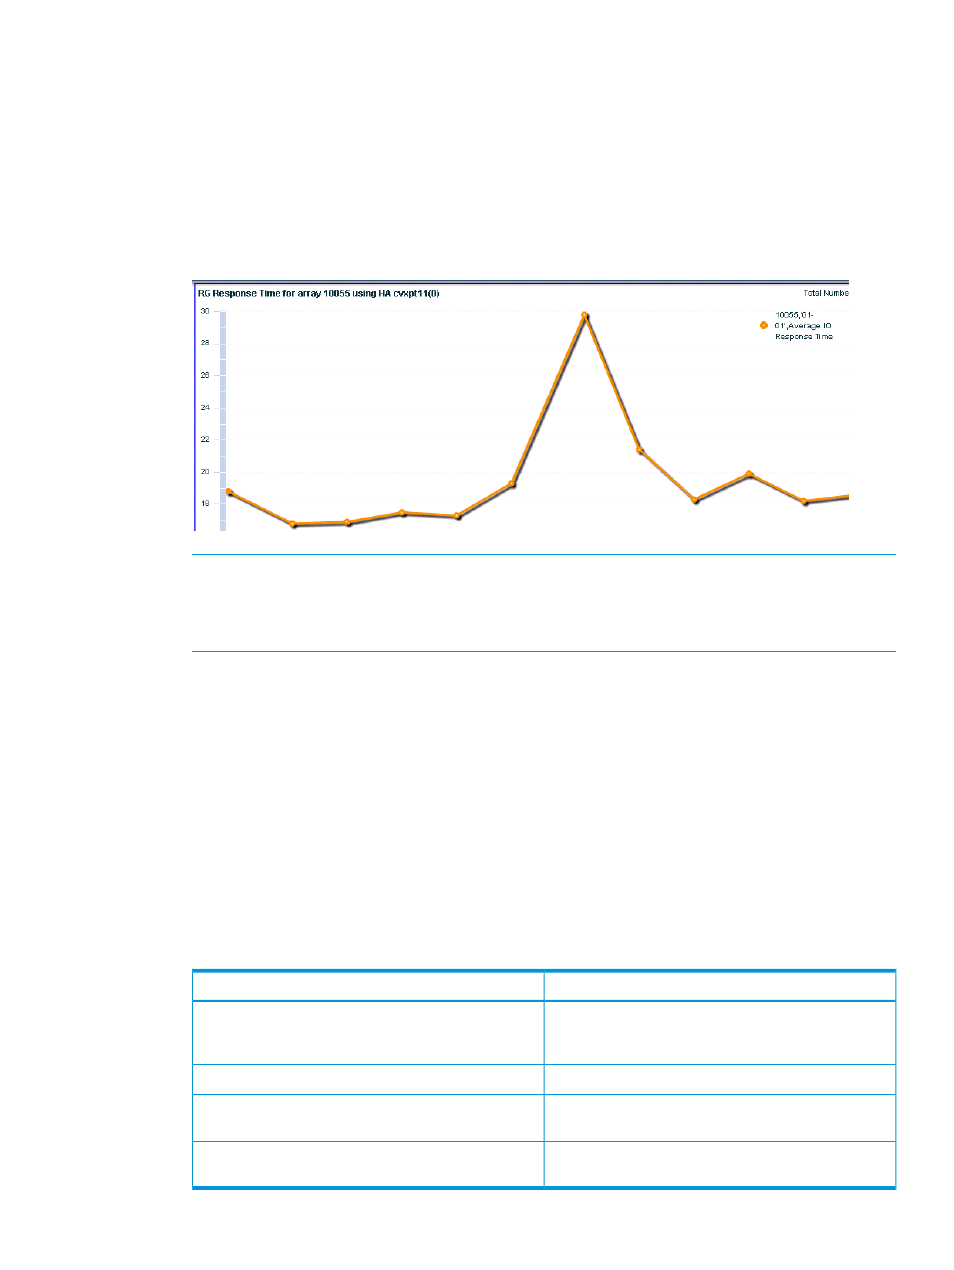
The following image shows the real-time charting graph for 10055, which belongs to the
XP12000 Disk Array type.
NOTE:
For the selected XP or P9000 disk array and host agent, if you want to select a
different combination of components for the real-time monitoring or choose another command
device, stop the current real-time performance data collection and start a new real-time
performance data collection.
Related Topics
•
“Stopping real-time performance data collection” (page 325)
•
Stopping real-time performance data collection
To stop a real-time data collection:
1.
Click Troubleshooting+RealTime in the left pane.
The RealTime screen appears.
2.
Click the Stop Collections tab.
The Stop Collections table displays the following details for the XP or the P9000 disk arrays,
or a combination of these arrays, for which real-time performance data collection is in progress:
Description
Screen elements
The serial number of the XP or the P9000 disk array for
which the real-time performance data collection is in
progress.
Array Id
The selected component category.
Component Type
The components for which the real-time performance
data collection is in progress.
Components
The host agent through which the real-time performance
data collection is in progress.
Host Agent
Troubleshooting using real-time performance data from XP and P9000 disk arrays 325
