HP XP P9000 Performance Advisor Software User Manual
Page 324

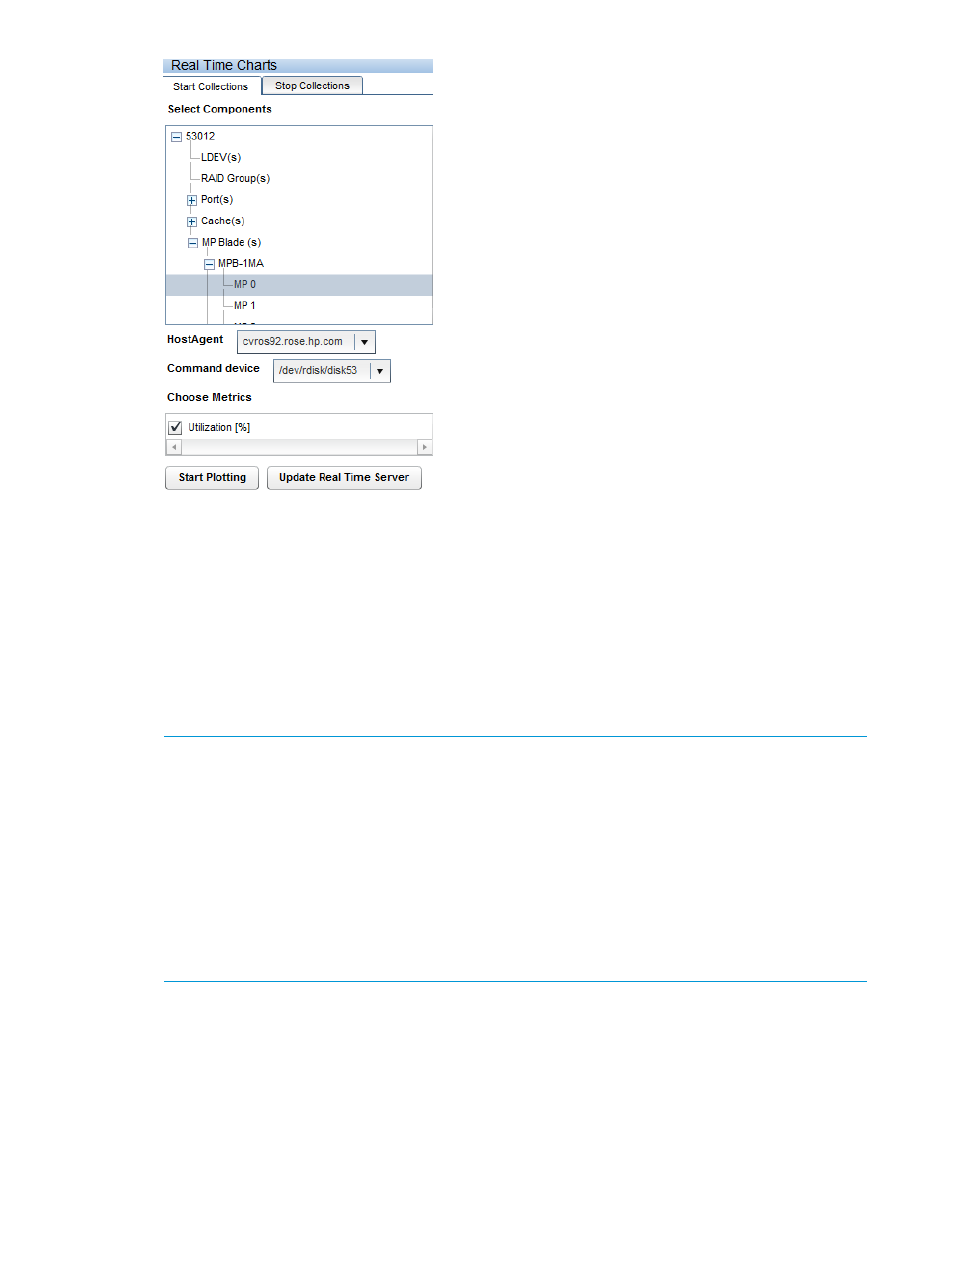
Additionally, the following are displayed:
•
HostAgent list: Displays the host agent that is connected to the selected XP or P9000 disk
array.
•
Command device list: Displays the command devices for the selected XP or P9000 disk
array. These command devices communicate with the host agents displayed in the
HostAgent list.
•
Choose Metrics list: Displays the set of real-time metrics based on the category that you
select.
3.
Click the plus (+) sign for a component category to view the associated list.
NOTE:
•
The LDEV component category displays the list of CUs and each CU provides the list of
LDEVs that belong to the CU.
•
For a P9000 disk array, the MP Blade category displays the MP blades and each MP
blade displays the list of MPs. From the list displayed, you can plot chart for only one MP
at a time.
•
For an XP disk array, the CHA(s) category displays the CHIP boards and each CHIP
board displays the list of MPs. Similary, the DKA(s) category displays the individual DKAs
and each DKA displays the list of MPs. From the list displayed for a CHIP board or DKA,
you can plot chart for only one MP at a time.
4.
Select a set of five or lesser number of components. Use the Shft or the Ctrl key for sequential
or random selection of components.
5.
Select the host agent name from the HostAgent box, if the XP or the P9000 disk array is
connected to more than one host agent. Every host agent can accept only one instance of a
real-time performance data collection request. If you want to use the same host agent for
another real-time data collection request, stop the current data collection and initiate the new
request. For more information, see
“Stopping real-time performance data collection” (page 325)
6.
Select the command device from the Command device list.
324 Troubleshooting issues for components associated with applications
