HP XP P9000 Performance Advisor Software User Manual
Page 202
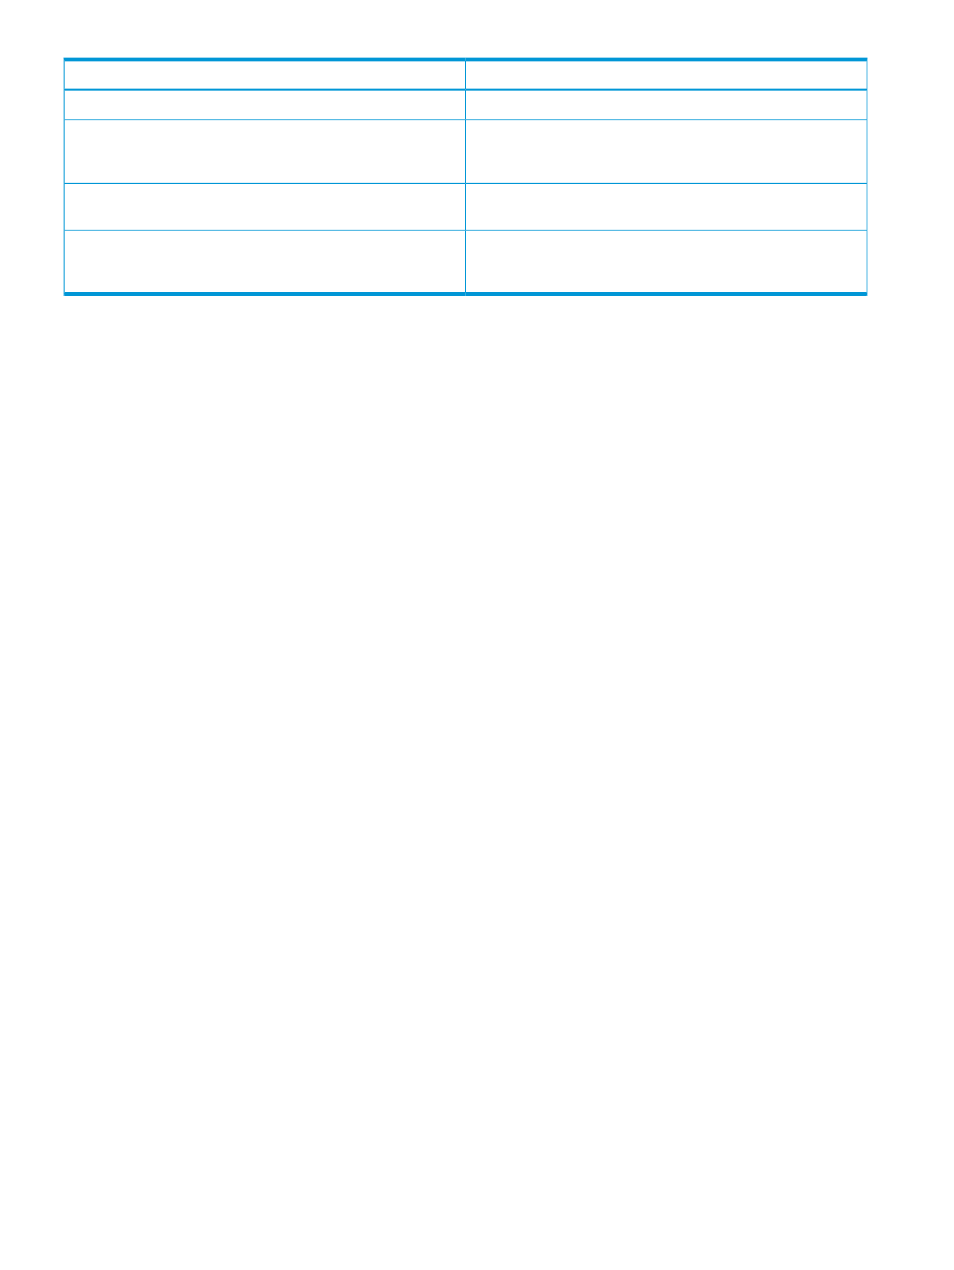
Description
Column names
Displays the amount of tier space that is already utilized.
Used Capacity
Displays the maximum storage that is accepted on a particular
tier level. You must have set this capacity threshold value on the
P9000 disk array.
Capacity Threshold
Displays the percentage of space allocated for each tier from
the total pool capacity to create a pool.
% of Tier Configured
Displays the maximum IOPH value that a tier can process. If the
value is NA, it indicates that the latest data from the performance
collection or monitoring cycle is unavailable.
Max IOPH Processed by the Tier
To understand how different tiers are utilized by a Smart pool, compare the utilization of individual
RAID groups that constitute the Smart pool. You can see the utilization of individual RAID groups
and also the overall utilization of all the RAID groups. You must determine the drive types of the
individual Raid groups that constitute the Smart pool. Also, you need to know the RAID group for
which you want to determine the drive type. The RAID groups are listed under Pool Volumes in the
Pool Details table. For more information on identifying the drive type for a RAID group, see
types navigation path” (page 265)
.
Related Topics
•
“Viewing performance summary” (page 177)
•
“Viewing ACP/DKA data” (page 190)
•
“Viewing MP blade utilization for P9000 disk arrays” (page 193)
•
“Utilization Summary” (page 183)
•
“Viewing continuous access data for P9000 disk arrays” (page 202)
•
“10 busiest LDEVs/Ports” (page 208)
•
“10 busiest LDEVs/RAID groups” (page 209)
•
•
“Viewing LDEV data” (page 216)
Viewing continuous access data for P9000 disk arrays
The Array - View Continuous Access screen provides data on the continuous access configurations
(synchronous, asynchronous, and journal based) created in the selected XP or P9000 disk array.
The configuration data includes the P-VOL, S-VOL, and associated port, RAID group details. If the
P-VOLs and S-VOLs are configured based on the CTGs to which they belong, the configuration
data of journal groups that manage the corresponding I/O transactions are also displayed. To
view the continuous access data for a P9000 disk array, click Monitoring+Array View in the left
pane. Then, click the plus (+) sign for a P9000 disk array in the component selection tree and
select Continuous Access from the list displayed.
202 Viewing XP and P9000 disk array components