4 showing and hiding waveforms (using the legend), 5 viewing the alarm occurrence status, 6 reading values with cursors – Yokogawa Data Logging Software GA10 User Manual
Page 67: Showing and hiding waveforms (using the legend) -5, Viewing the alarm occurrence status -5, Reading values with cursors -5
4-5
IM 04L65B01-01EN
Chapter 4 Monitoring Data Collection
4.2.4 Showing and Hiding Waveforms (Using the
Legend)
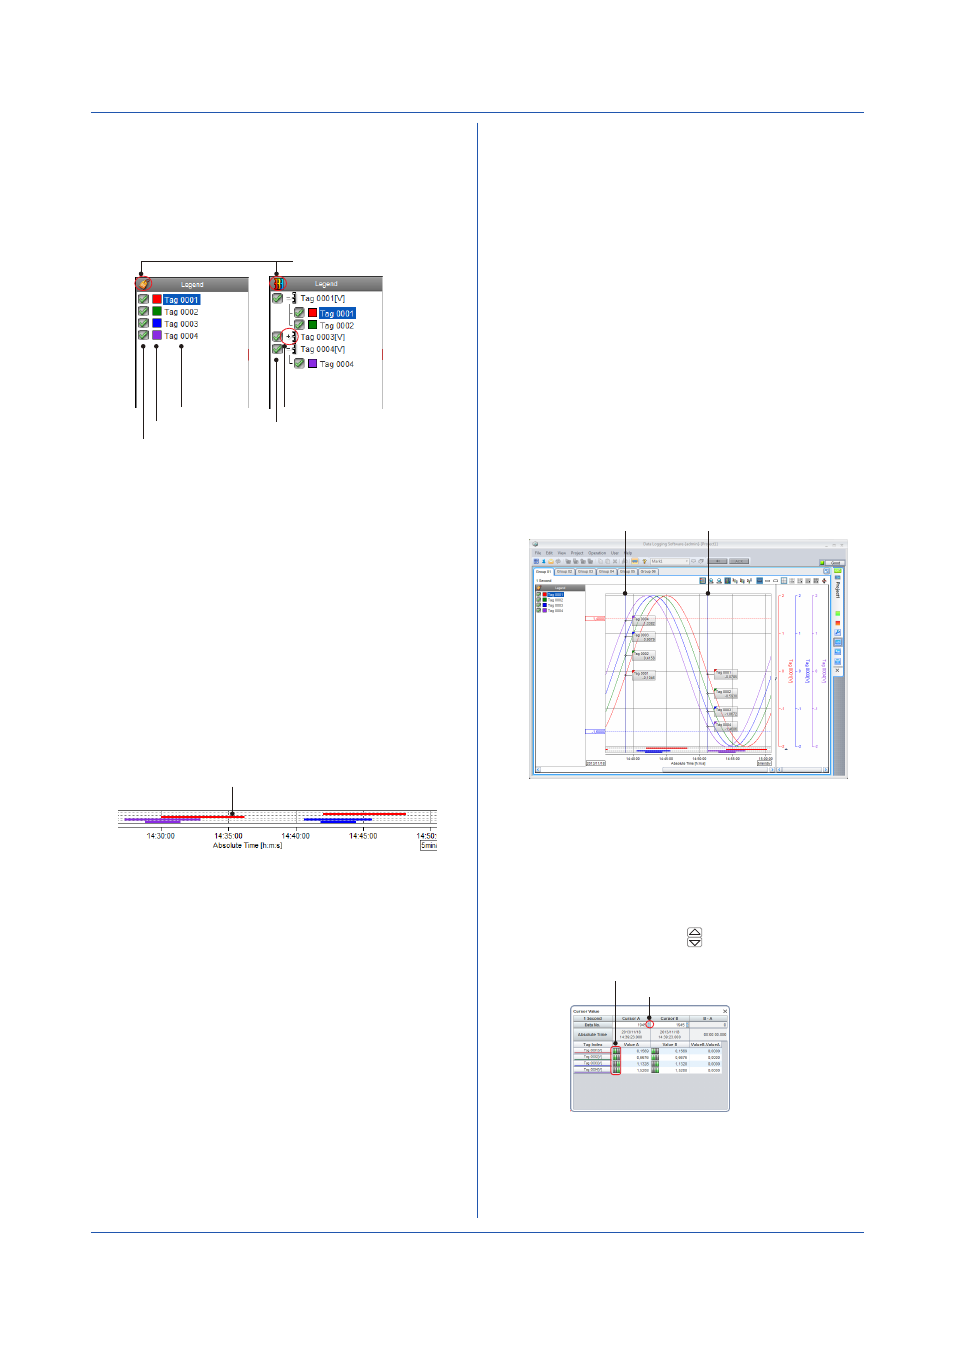
The legend can be displayed in tag display mode or axis
display mode. Each time you click the display mode icon,
the mode toggles between tag display and axis display.
Tag name
Tag color
Waveform check icon
Tag display mode
Axis display mode
Click + to display tags.
Axis check icon
Display mode icon
• Tag Display Mode
The tags assigned to the display group are displayed.
Waveforms whose waveform check icons are selected
are shown. If you click an icon to clear the check box,
the waveform will be hidden.
• Axis Display Mode
A list of Y-axes used by tags is displayed. Expand a
Y-axis to display a list of tags that are using the Y-axis.
If you click an Y-axis check icon to clear the check box,
the axis and waveform data sharing the axis will be
hidden.
4.2.5 Viewing the Alarm Occurrence Status
When you click
Alarm on the View menu to add a check
mark, alarm bars are displayed in the alarm display area.
Remove the check mark to hide the alarm bars.
Alarm bar
The bars show the data range in which alarms are
occurring for the tags displayed in the group. The alarms
are from the top alarm level 1, alarm level 2, alarm level 3,
and alarm level 4.
• Alarm bars are displayed with tag display colors.
• The alarm bars of the active waveform area always
shown in front. If the alarm bars of multiple tags are
overlapped and you want to view the alarm bars in
the back, make the appropriate waveform the active
waveform.
4.2.6 Reading Values with Cursors
You can use cursors to read values from waveforms. You
can display two cursors: cursor A and cursor B.
• Showing and Hiding Cursors
1
Click a point in the waveform graph.
Cursor A (vertical line) appears, and the value at the
intersection of the cursor and waveform is displayed.
2
Drag the cursor, and release the mouse button.
Cursor B (vertical line) appears, and the value at the
intersection of the cursor and waveform is displayed.
3
To clear the cursors, on the
View menu, click Erase
cursor.
If the cursor value displays of multiple tags are
overlapped and you want to view the cursor values in
the back, make the appropriate waveform the active
waveform. Or, use the cursor value dialog box.
When a cursor is displayed, the waveform display
enters playback mode, and automatic updating of data
display stops.
Cursor
Cursor
• Cursor Value Transparency
On the
View menu, click Cursor value transparency
to choose
Transparent or Opaque.
• Reading the Difference between Two Cursors
On the
View menu, click Cursor value. The Cursor
Value dialog box appears. From this dialog box, you
can read the difference between cursors A and B.
Click the cursor move icon ( ) to move the cursor by 1
data point.
Alarm indicator
Cursor movement icon