2 monitoring on the trend display, 1 displayed content, 2 changing the display – Yokogawa Data Logging Software GA10 User Manual
Page 65: Monitoring on the trend display -3, Displayed content -3, Changing the display -3
4-3
IM 04L65B01-01EN
4.2 Monitoring on the Trend Display
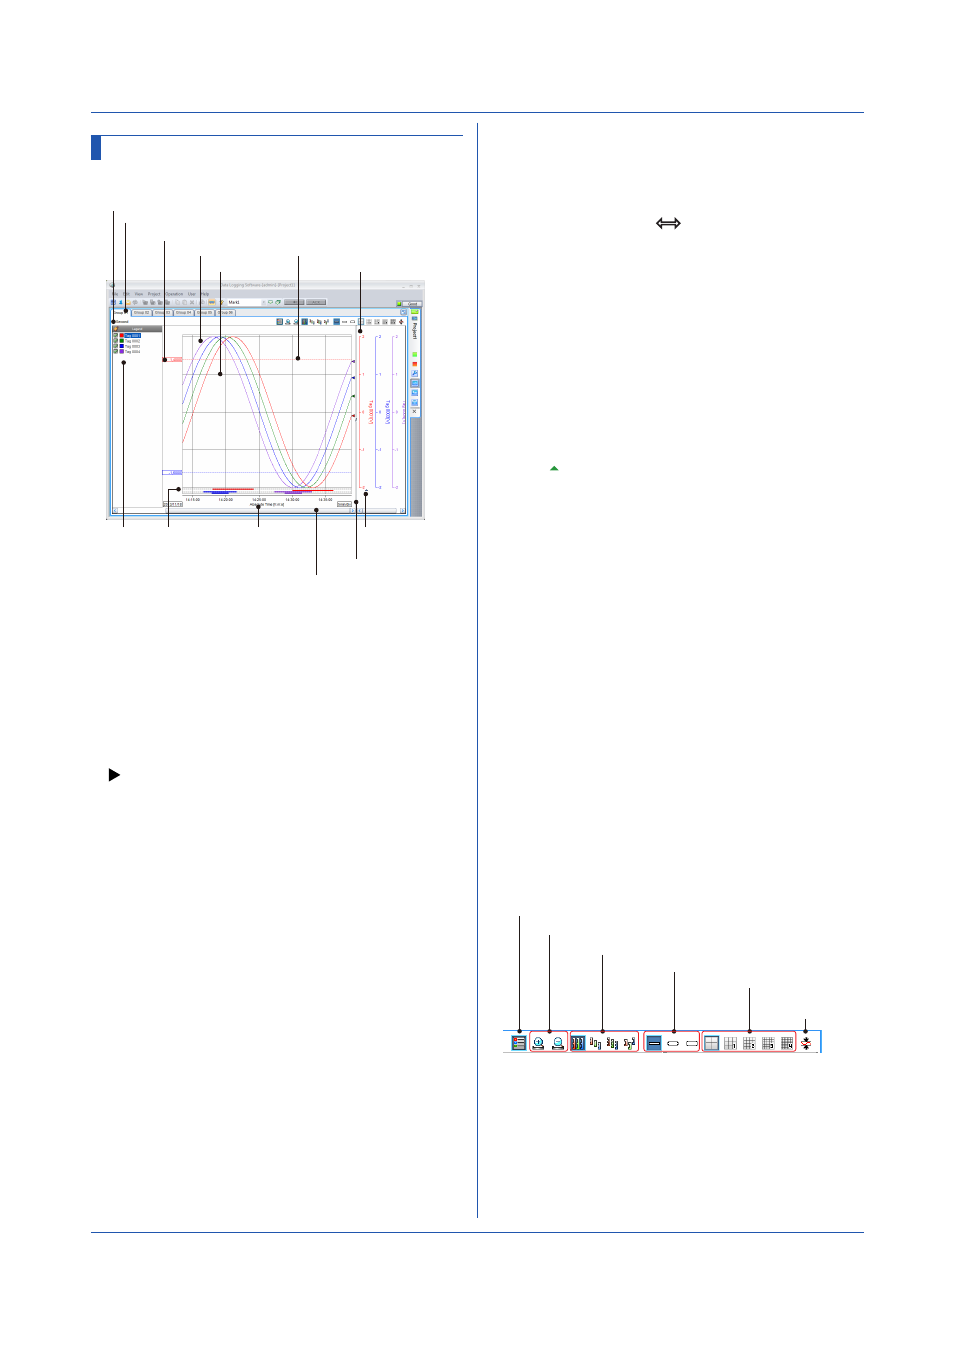
4.2.1 Displayed Content
Scan interval
Group tab
Waveform
Grid
Trip line
Alarm display Time axis
Y-axis
Legend
Vertical splitter
Active
waveform mark
Time axis scroll bar
Trip line value
• Scan Interval
The data collection interval.
• Group Tab
Switches the displayed group. Alarms occurring in tags
of each group are indicated in red.
• Waveform
Displays each waveform according to its corresponding
data tag color.
• Grid
The grid shown in the waveform display area.
• Trip Line
Trip line assigned to a tag. Only the trip line of the
active waveform is displayed.
Moving the trip line
Drag the value of the trip line to the desired position.
• Y-axis
Displays the Y-axis scale, title, and unit. Each y-axis is
displayed according to its corresponding tag color.
• Legend
Displays tags, tag colors, waveform display on/off
check boxes, and Y-axis display on/off check boxes.
• Alarm Display
Displays alarms using bars from occurrence to release.
• Time Axis
The right end shows the most recent data time.
Chapter 4 Monitoring Data Collection
• Vertical Splitter
Use the vertical splitter to adjust the width of the Y-axis
display area.
When you move the pointer over the vertical splitter,
the pointer changes to
. In this condition, drag the
pointer to expand or reduce the width of the Y-axis
display area.
Waveform Display
• Active Waveform
The front-most displayed waveform is called the active
waveform.
• Changing the Active Waveform
Click a tag in the Legend or a Y-axis to make the
corresponding waveform the active waveform. When
a Y-axis is shared among multiple waveforms, the
waveform with the smallest waveform number will
become the active waveform. The active waveform
mark ( ) moves below the Y-axis of the active
waveform.
• Automatically Updating the Displayed Data
(monitor mode)
When the time-axis scroll bar is at the right end
or when it is not displayed, the data display is
automatically updated. This mode is called monitor
mode. The right end of the waveform is the most recent
data.
• Viewing Past Data (playback mode)
Move the time-axis scroll bar from the right end to
view past data. This mode is called playback mode.
Automatic updating of the data display stops.
Returning the scroll bar to the right end switches GA10
back to monitor mode. If you do not operate the scroll
bar for 30 minutes, GA10 will return to monitor mode.
When Collecting Data Using Device Time
The window is divided by a combination of device
and scan interval. Trends of up to four devices can be
displayed at each scan interval.
4.2.2 Changing the Display
You can change the display using the icons in the upper
right.
Show or hide the legend
Zoom in on or out of the time axis
Y-axis display zone
Waveform line thickness
Grid density
Waveform
display limit
• Show or Hide the Legend
You can show or hide the legend.
• Zoom in on or out of the Time Axis
You can zoom in on or out of the time axis.