3 controlling the y-axis, Controlling the y-axis -4 – Yokogawa Data Logging Software GA10 User Manual
Page 66
4-4
IM 04L65B01-01EN
Chapter 4 Monitoring Data Collection
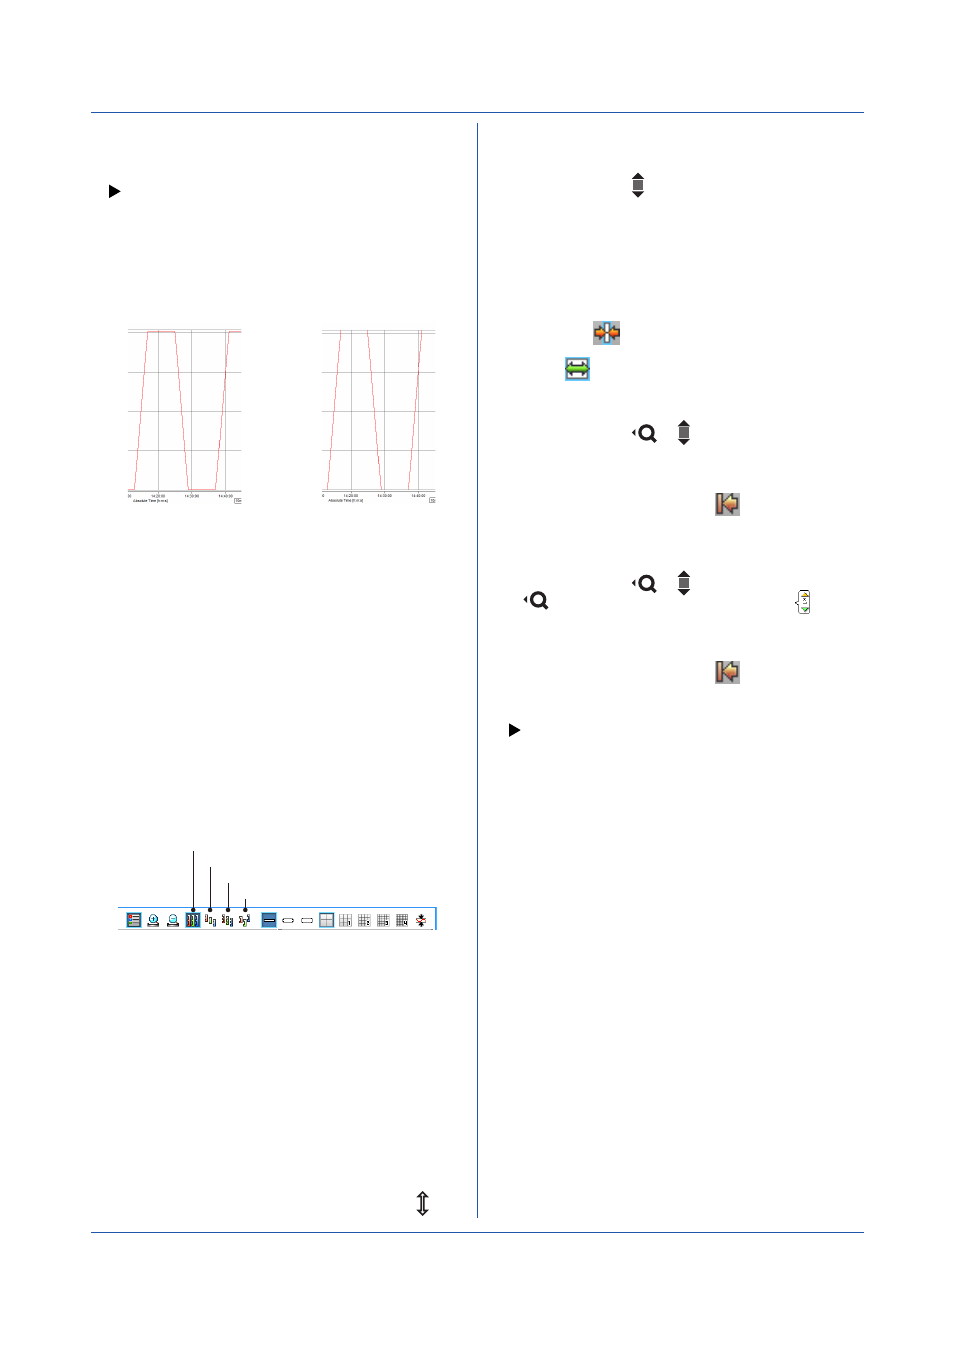
• Y-axis Display Zone
You can switch the Y-axis display zone.
• Waveform Line Thickness
You can change the waveform line thickness. This
applies to all waveforms.
• Grid Density
You can change the grid density.
• Waveform Display Limit
With limit
Without limit
When you click the icon to select it, waveform display
limit is enabled. When you apply the waveform display
limit, the Y-axis display range is limited to the minimum
and maximum values that you specified using Scale
in Display Group. Measured values that are less than
the minimum scale value are set to the minimum
value, and values that are greater than the maximum
scale value are set to the maximum value. When you
click the icon to unselect it, waveform display limit is
disabled. In this condition, measured values outside the
scale are displayed as they are.
4.2.3 Controlling the Y-axis
• Y-axis Display Zone
You can select the Y-axis display zone.
Y-axis display zone specifies the scale position and
length. It is the waveform position and range.
Full zone
Slide zone
Auto zone
Free zone
• Full Zone: Displays all waveforms in the maximum
range
• Slide Zone: Displays each waveform cascaded from
the top to the bottom of the waveform display area
• Auto Zone: Divides the waveform display area
into equally spaced zones in accordance with the
number of waveforms and displays the waveforms
• Free Zone: Displays waveforms in user-specified
zones
• Operations in Free Zone
In Free Zone mode, you can change the Y-axis display
zone as you like.
Zoom in/out on the Y-axis
When you move the pointer near the lower or upper
edge of the Y-axis scale, the pointer changes to . In
this condition, drag the pointer to move the desired
position to zoom in or out on the Y-axis.
Moving the Y-axis
When you move the pointer on an Y-axis scale, the
pointer changes to . In this condition, drag the pointer
to move the desired position to move the Y-axis to the
desired position.
• Compact Mode and Detail Mode
A Y-axis can be displayed in compact or detail mode. In
compact mode, scale values are hidden, narrowing the
width of the Y-axis.
In detail mode, if you move the pointer on the Y-axis
and click the
icon at the top of the Y-axis, the
mode changes to compact. In compact mode, if you
click the
icon, the mode changes to detail.
• Scrolling a Y-axis Scale
When you move the pointer on an Y-axis scale, the
pointer changes to
or .
Spinning the mouse wheel in this condition causes
the Y-axis scale to scroll, maintaining the difference
between the upper and lower limits of the scale.
Click the scale initialization icon
to return the scale
to its original position.
• Zooming in or out on an Y-axis Scale
When you move the pointer on an Y-axis scale, the
pointer changes to
or . Clicking when the pointer
is
shows a scale zoom in/zoom out icon .
Click an arrow of the icon or spin the mouse wheel to
zoom in or out on the scale value in reference to the
icon position.
Click the scale initialization icon
to return the scale
to its original position.
• Changing the Active Waveform