3 displaying multiple graphs – Teledyne LeCroy USBTracer_Trainer - Users Manual User Manual
Page 234
Chapter 9: Reports
USB Protocol Suite User Manual
220
LeCroy Corporation
9.15.3 Displaying Multiple Graphs
The Real Time Statistics window gives you the ability to create up to three separate
graphing windows so that you can create separate graphs of traffic and tile them
vertically. Within these windows, you can format the graphs in a number of ways.
•
To view two or three graphs simultaneously,
click the Graph Areas
button.
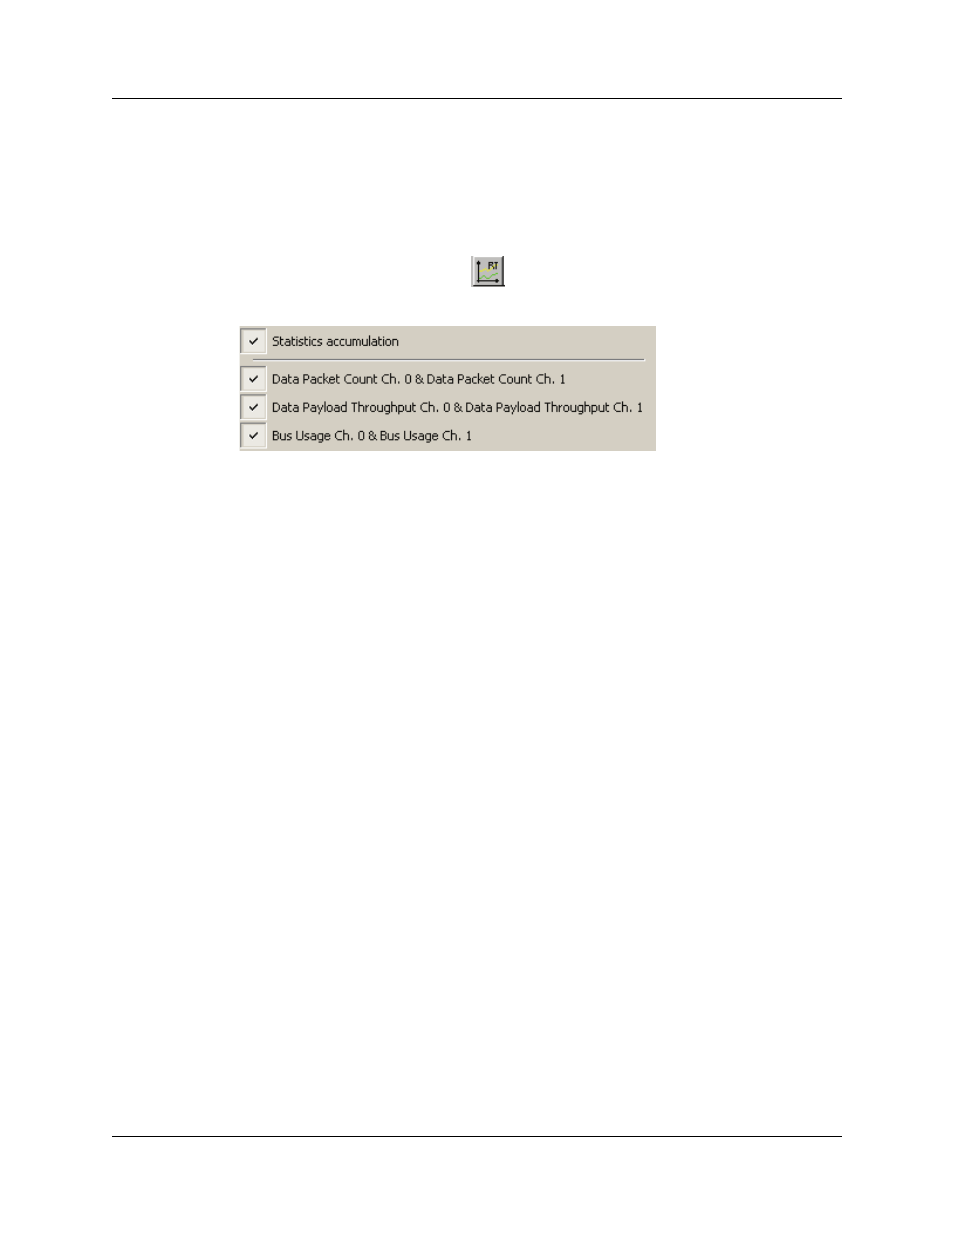
The following menu opens.
Selecting a checkbox displays the selected graph type:
•
Statistics Accumulation: Plots the percentage of Link utilization by non-idle
traffic for both directions of the link.
•
Data Packet Count (Packets/s): Plots counts of Data Packets per second for
both directions of the link.
•
Data Payload Throughput (MBytes): Plots data payload throughput for both
directions of the link.
•
Bus Usage: Plots amount of Bus usage.