1 real-time statistics buttons – Teledyne LeCroy USBTracer_Trainer - Users Manual User Manual
Page 232
Chapter 9: Reports
USB Protocol Suite User Manual
218
LeCroy Corporation
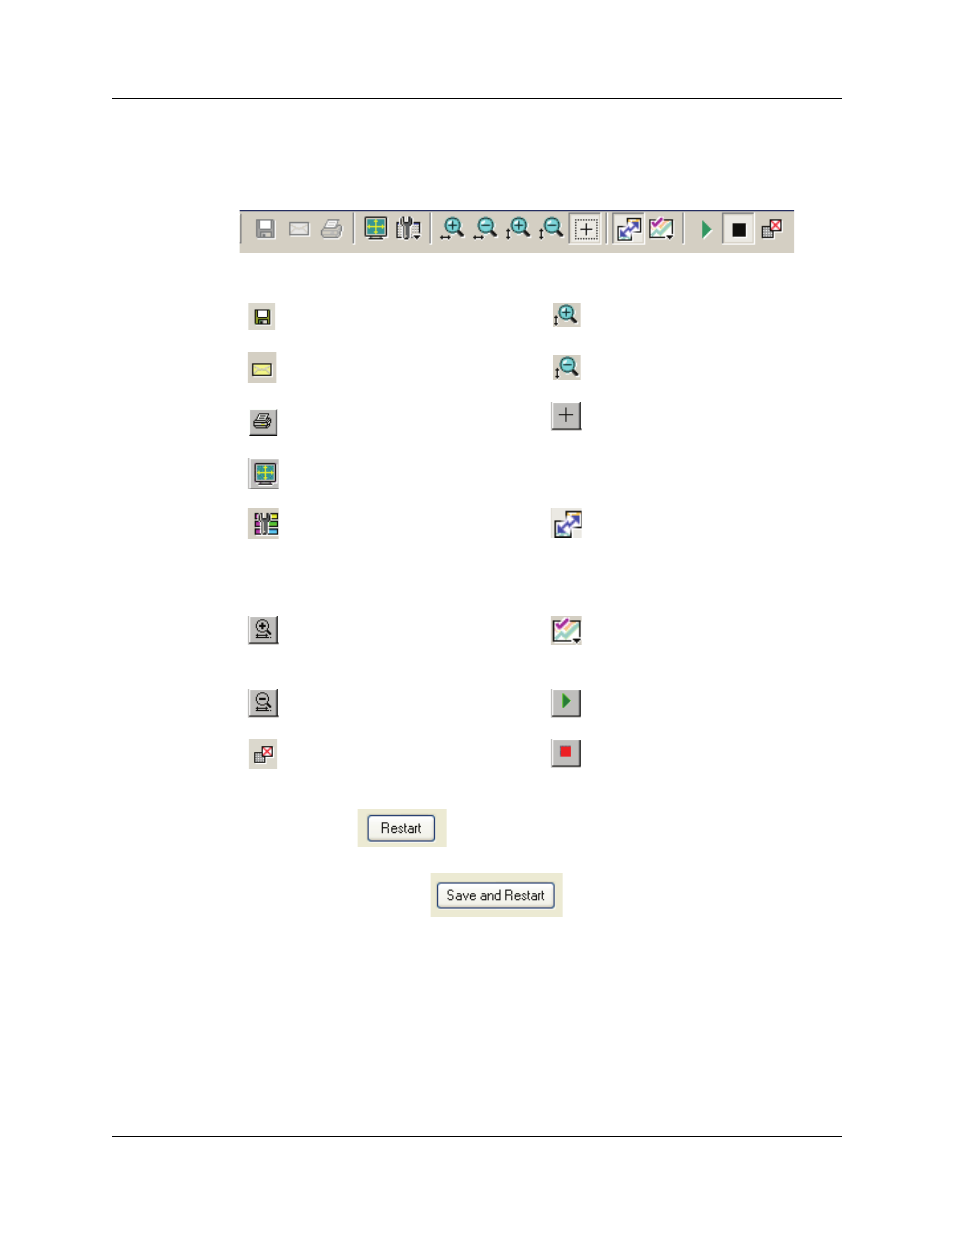
9.15.1 Real-Time Statistics Buttons
The Real-Time Statistics toolbar has buttons for changing the format of the displayed
data and for exporting data:
The buttons have the following functions:
To clear the counters in the “Statistics Accumulation” area,
click the Restart button.
To save a snapshot Microsoft Excel .csv file of the data before clearing the values,
click the Save and Restart button.
The file is in the same folder where Trace files are saved.
The naming convention of the file is:
RTS_Capture_YYYY-MM-DD_HH-MM-SS.csv
Note 1: Because file writing must happen immediately, there is no file naming dialog.
Note 2: If you click the button more than once a second, the previous file with the same
timestamp will be lost.
Save As - Saves Real-Time graphs
as bitmap files (*.bmp)
Vertical zoom in
Email - Creates an email with a
*.bmp file attachment of the graphs
Vertical zoom out
Click and Drag zoom - Click
diagonally to select and zoom in on
part of the graph
Full Screen
View Settings - opens a sub-menu
with options for formatting the
display. See
Menu” below.
Sync and Graph areas - If two or
more graphs are displayed, this
button synchronizes the graphs to
one another. Once synchronized, the
positioning slider of one graph
moves the other graphs.
Horizontal zoom in
Graph Areas - Presents options for
displaying additional graphs of data
lengths, packet lengths, and
percentage of bus utilized.
Horizontal zoom out
Start. Starts the Real-Time Monitor.
Reset graphs.
Stop Real-Time Monitoring.