Casio FX-CG10 User Manual
Page 521
15-10
u To delete all plots
Press
K6(g)4(DELETE), and a confirmation dialog box will appear. Press 1(Yes) to
delete all of the plots. To cancel the delete operation, press
6(No) instead.
Note
• In addition to using the plot list screen to delete all plots, you also can sequentially delete
plots one-by-one, starting from the last point plotted. See “Deleting the Last Plot Data Line”
(page 15-14).
k Inputting an Expression of the Form Y=
f
(
x
) and Graphing It
You can draw a graph based on an expression with the form Y=
f
(
x
) on the Picture Plot screen.
From the Picture Plot screen, press
K4(DefG) to display the graph relation list screen.
From there, operations are identical to those in the Graph mode.
Note
• The data on the graph relation list screen is shared with the Graph mode. Note, however,
that only Y= type graphs can be used in the Picture Plot mode. Because of this, calling up
the graph relation list screen from the Picture Plot mode will display a “Y” (Y= type) item for
function menu key
3. Also note that the 5(MODIFY) function menu item is not displayed
on the graph relation list screen. The Modify function can be executed from the Picture Plot
screen.
• Y= type expressions on the graph relation list screen that include variables can be modified
by pressing
K5(MODIFY) while the Picture Plot screen is displayed. For details about
this operation, see “Modifying a Graph” (page 5-36).
k Using Regression Graphs
You can perform regression calculation based on plotted coordinate values and draw a
regression graph.
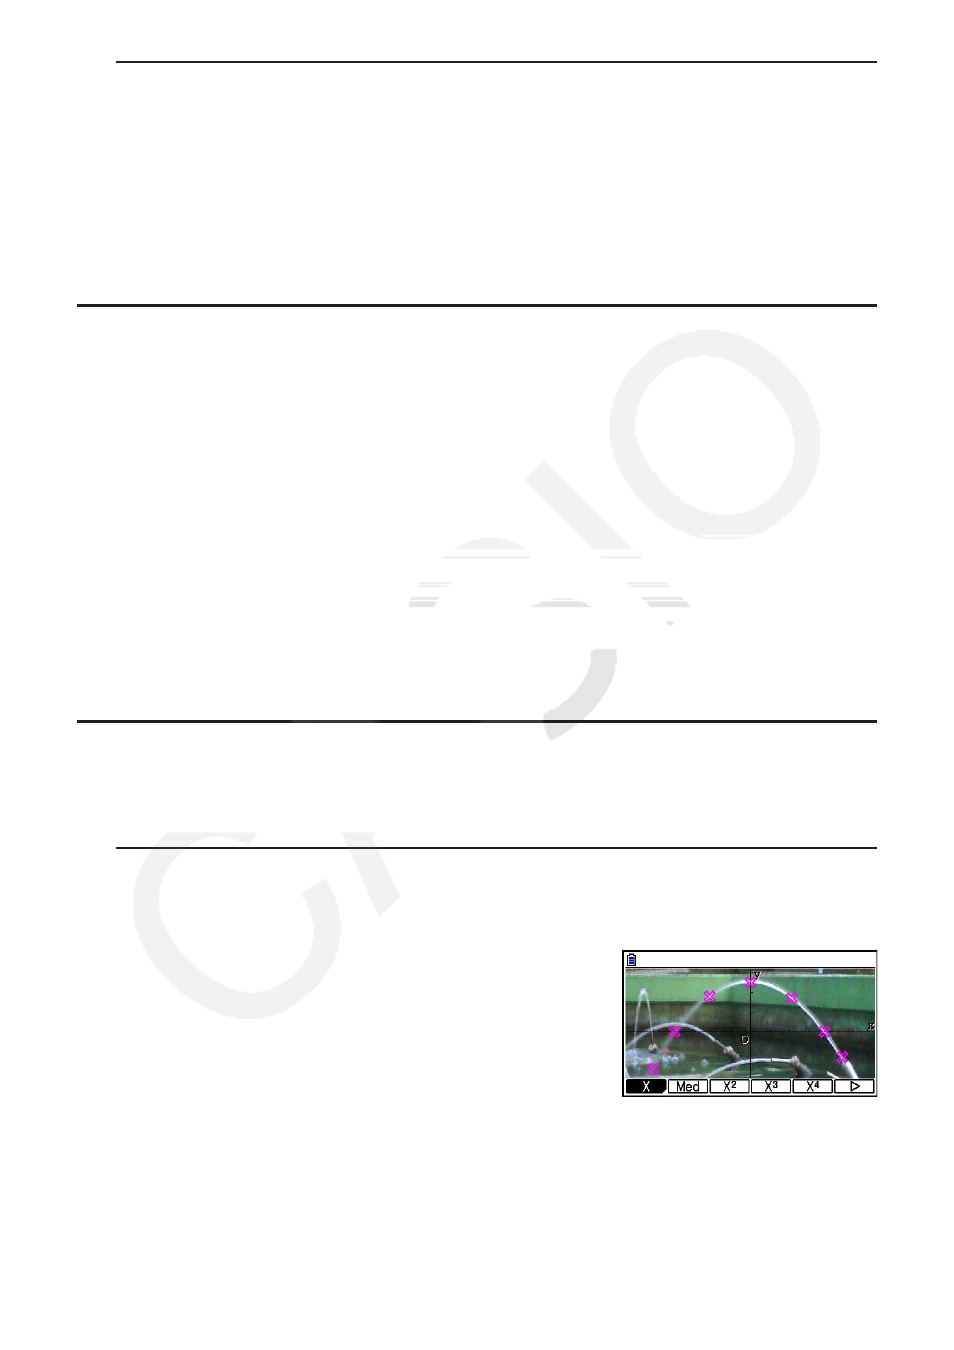
u To draw a regression graph overlaid on plots
1. Perform the procedure under “To plot points on the screen” (page 15-7).
2. Press
K6(g)2(REG).
• This displays the regression calculation type function
menu.