Casio FX-CG10 User Manual
Page 236
6-43
The following item appears in the case of Two-Way ANOVA only.
Factor B ........ list to be used for category data (List 1 to 26)
GphColor ...... specifies the graph line color (page 6-33)
After setting all the parameters, use
c to move the highlighting to “Execute” and then press
one of the function keys shown below to perform the calculation or draw the graph.
•
1(CALC) ... Performs the calculation.
•
6(DRAW) ... Draws the graph (Two-Way ANOVA only).
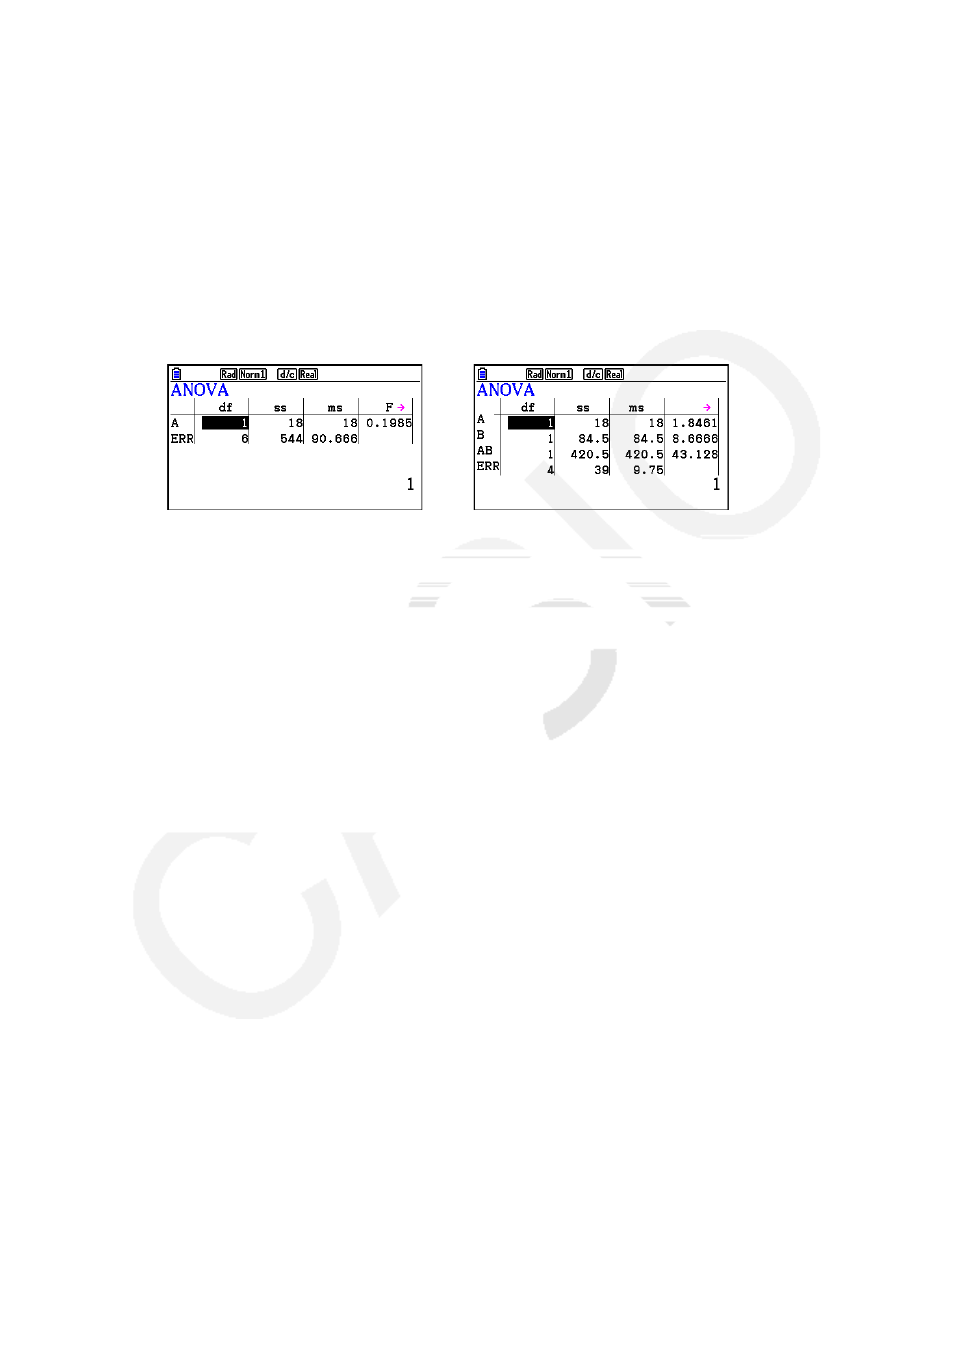
Calculation results are displayed in table form, just as they appear in science books.
Calculation Result Output Example
One-Way ANOVA
Line 1 (A) .......... Factor A
df
value,
SS
value,
MS
value,
F
value,
p
-value
Line 2 (ERR) ..... Error
df
value,
SS
value,
MS
value
Two-Way ANOVA
Line 1 (A) .......... Factor A
df
value,
SS
value,
MS
value,
F
value,
p
-value
Line 2 (B) .......... Factor B
df
value,
SS
value,
MS
value,
F
value,
p
-value
Line 3 (AB) ........ Factor A
× Factor B
df
value,
SS
value,
MS
value,
F
value,
p
-value
* Line 3 does not appear when there is only one observation in each
cell.
Line 4 (ERR) ..... Error
df
value,
SS
value,
MS
value
F
......................
F
value
p
.......................
p
-value
df
..................... degrees of freedom
SS
..................... sum of squares
MS
................... mean squares
With Two-Way ANOVA, you can draw Interaction Plot graphs. The number of graphs depends
on Factor B, while the number of X-axis data depends on the Factor A. The Y-axis is the
average value of each category.
You can use the following graph analysis function after drawing a graph.
•
1(Trace) or !1(TRACE) ... Trace function
Pressing
d or e moves the pointer on the graph in the corresponding direction. When there
are multiple graphs, you can move between graphs by pressing
f and c.