Casio FX-CG10 User Manual
Page 158
5-26
k Drawing Multiple Graphs on the Same Screen (Overwrite Graph)
Use the following procedure to assign various values to a variable contained in an expression
and overwrite the resulting graphs on the screen.
1. From the Main Menu, enter the Graph mode.
2. On the Setup screen, change the “Dual Screen” setting to “Off”.
3. Configure V-Window settings.
4. Specify the function type and input the function. The following is the syntax for function
input.
Expression containing one variable ,
!+( [ ) variable !.(=) value , value ,
... , value
!-( ] )
5. Draw the graph.
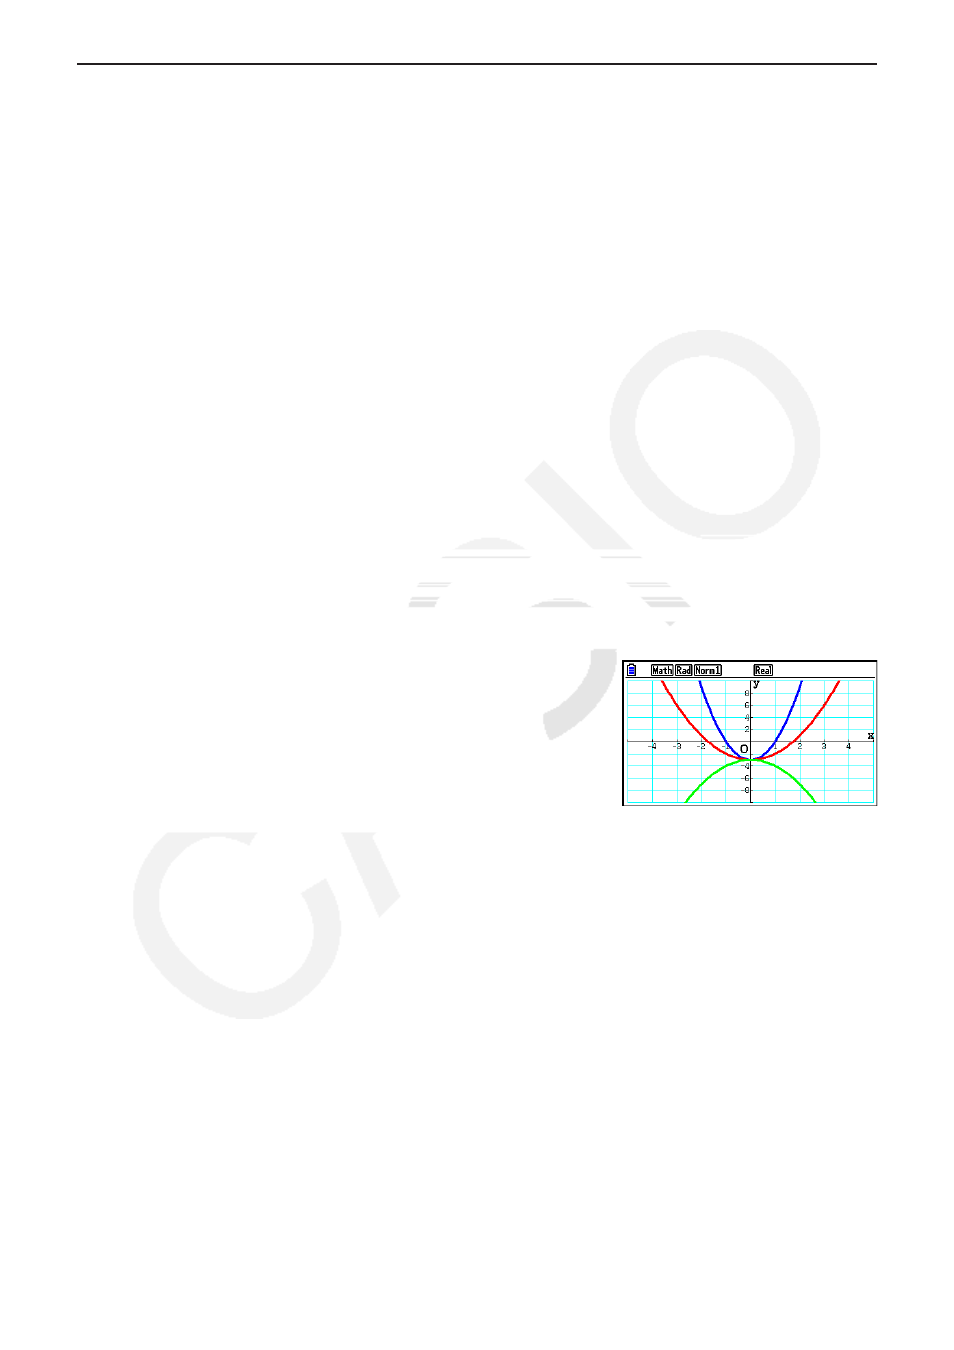
Example
To graph y = A
x
2
– 3 as the value of A changes in the sequence 3, 1, –1
Use the following V-Window settings.
Xmin = –5,
Xmax = 5,
Xscale = 1
Ymin = –10,
Ymax = 10,
Yscale = 2
1
m Graph
2
!m(SET UP)cccc3(Off)J
3
!3(V-WIN) -fwfwbwc
-bawbawcwJ
4
3(TYPE) 1(Y=) av(A) vx-d,
!+( [ ) av(A) !.(=) d,b,-b
!-( ] )w
5
6(DRAW)
• When multiple graphs are drawn simultaneously with the above operation, they are drawn
using five different colors in the following sequence: blue, red, green, magenta, black. The
first graph is drawn using the color specified for an expression that is registered on the graph
relation list screen, followed by the next color in the above sequence.
Due to display readability considerations, if cyan or yellow is specified for the expression, the
default color for the graph relation list screen line where the expression is registered will be
used instead.