K specifying the graph range – Casio FX-CG10 User Manual
Page 139
5-7
u To recall V-Window memory settings
1. From the Main Menu, enter the Graph mode.
2. Press
!3(V-WIN) to display the V-Window setting screen.
3. Press
4(V-MEM)2(RECALL) to display the pop-up window.
4. Press a number key to specify the V-Window memory number for the settings you want to
recall, and then press
w. Pressing bw recalls the settings in V-Window Memory 1
(V-Win1).
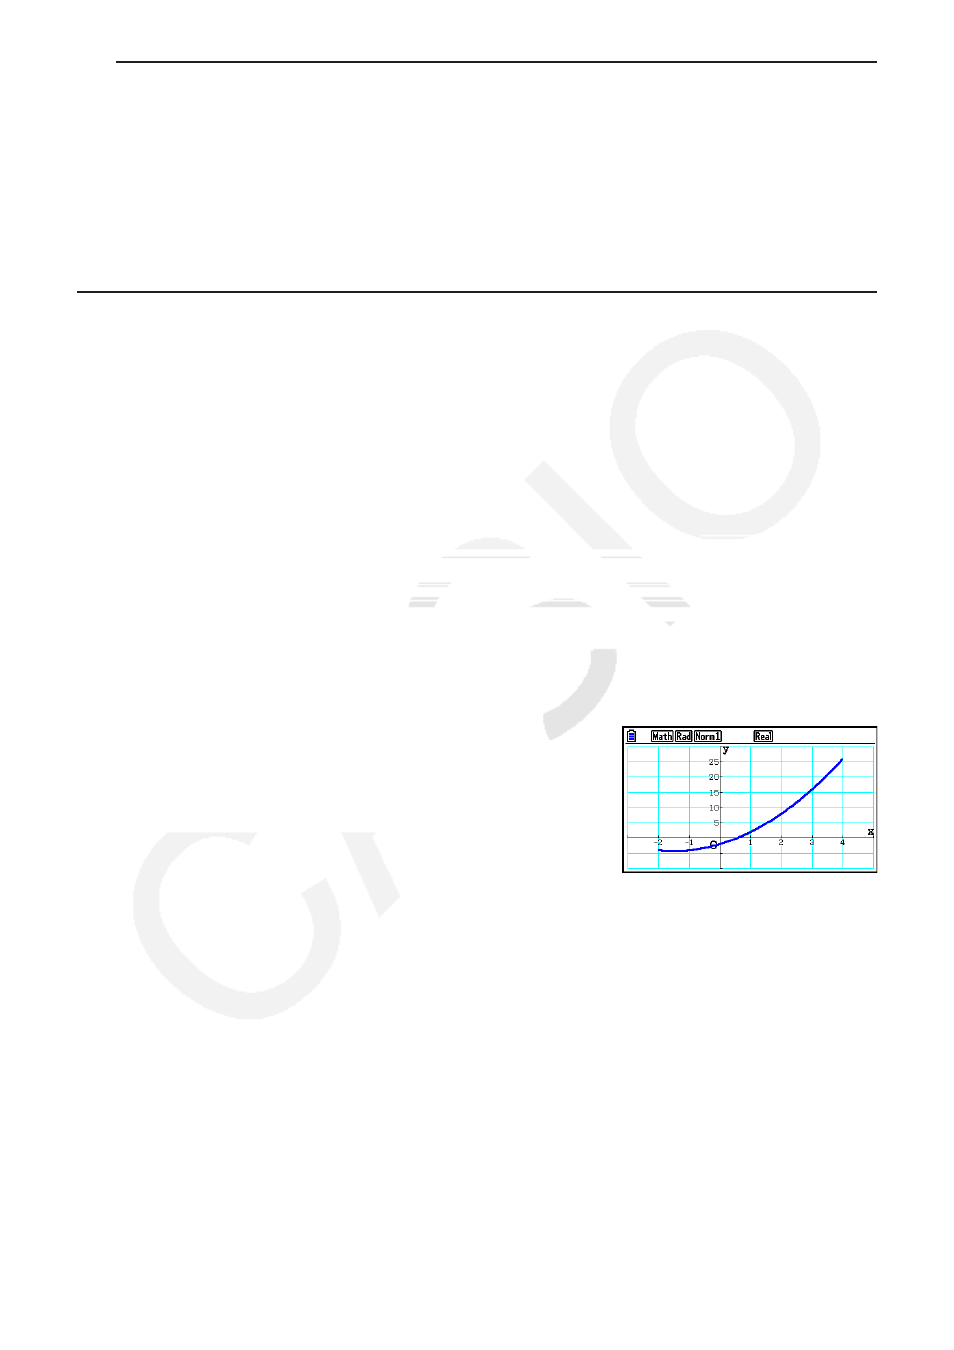
k Specifying the Graph Range
You can define a range (start point, end point) for a function before graphing it.
1. From the Main Menu, enter the Graph mode.
2. Configure V-Window settings.
3. Specify the function type and input the function. The following is the syntax for function
input.
Function
,
!+( [ ) Start Point , End Point !-( ] )
4. Draw the graph.
Example Graph
y
=
x
2
+ 3
x
– 2 within the range – 2 <
x
< 4.
Use the following V-Window settings.
Xmin = –3,
Xmax = 5,
Xscale = 1
Ymin = –10,
Ymax = 30,
Yscale = 5
1
m Graph
2
!3(V-WIN) -dwfwbwc
-bawdawfwJ
3
3(TYPE) 1(Y=) vx+dv-c,
!+( [ ) -c,e!-( ] ) w
4
6(DRAW)
• You can specify a range when graphing rectangular expressions, polar expressions,
parametric functions, and inequalities.