K graphing a recursion formula – Casio FX-CG10 User Manual
Page 176
5-44
Example
Generate a number table from recursion between three terms as
expressed by
a
n
+2
=
a
n
+1
+
a
n
, with initial terms of
a
1
= 1,
a
2
= 1 (Fibonacci
sequence), as
n
changes in value from 1 to 6.
1
m Recursion
2
3(TYPE) 3(
a
n
+2
)
3
4(
n
.
a
n
··)
3(
a
n
+1
) +
2(
a
n
)
w
4
5(SET) 2(
a
1
) b
wgwbwbwJ
5
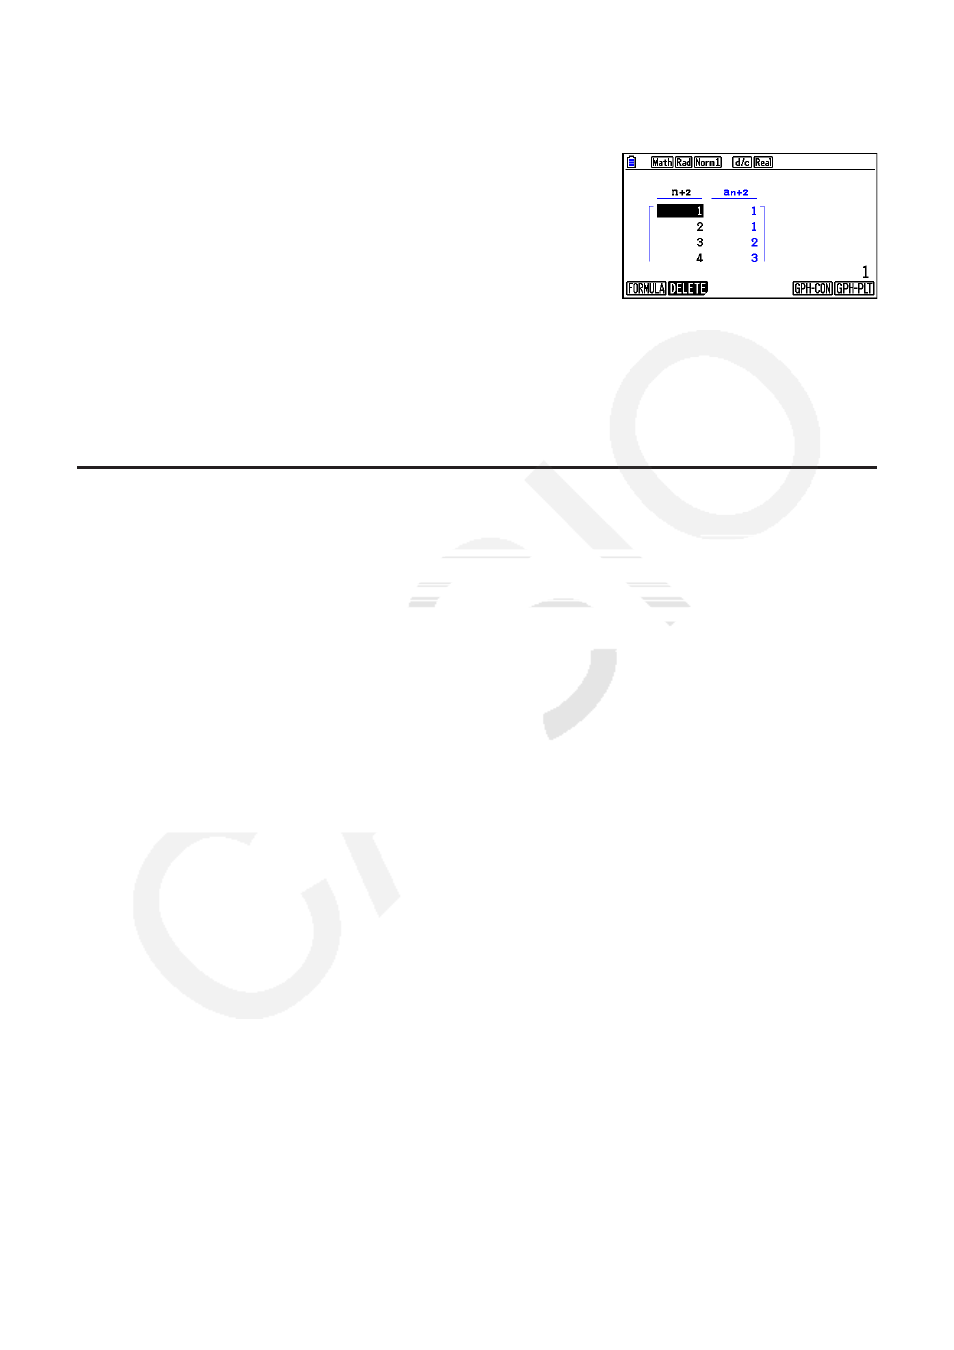
6(TABLE)
*
The first two values correspond
to
a
1
= 1 and
a
2
= 1.
• Pressing
1(FORMULA) will return to the screen for storing recursion formulas.
• Specifying “On” for the “
Σ Display” of the Setup screen causes the sum of each term to be
included in the table.
k Graphing a Recursion Formula
After generating a number table from a recursion formula, you can graph the values on a line
graph or plot type graph.
1. From the Main Menu, enter the Recursion mode.
2. Configure V-Window settings.
3. Specify the recursion formula type and input the formula.
4. Specify the table range, and start and ending values for
n
. If necessary, specify the initial
term value and pointer start point.
5. Select the line style for the graph.
6. Display the recursion formula number table.
7. Specify the graph type and draw the graph.
5(GPH-CON) ... line graph
6(GPH-PLT) ... plot type graph
Example
Generate a number table from recursion between two terms as
expressed by
a
n
+1
= 2
a
n
+
1, with an initial term of
a
1
= 1, as
n
changes in
value from 1 to 6. Use the table values to draw a line graph.
Use the following V-Window settings.
Xmin = 0,
Xmax = 6,
Xscale = 1
Ymin = –15,
Ymax = 65,
Yscale = 5