Casio FX-CG10 User Manual
Page 384

9-33
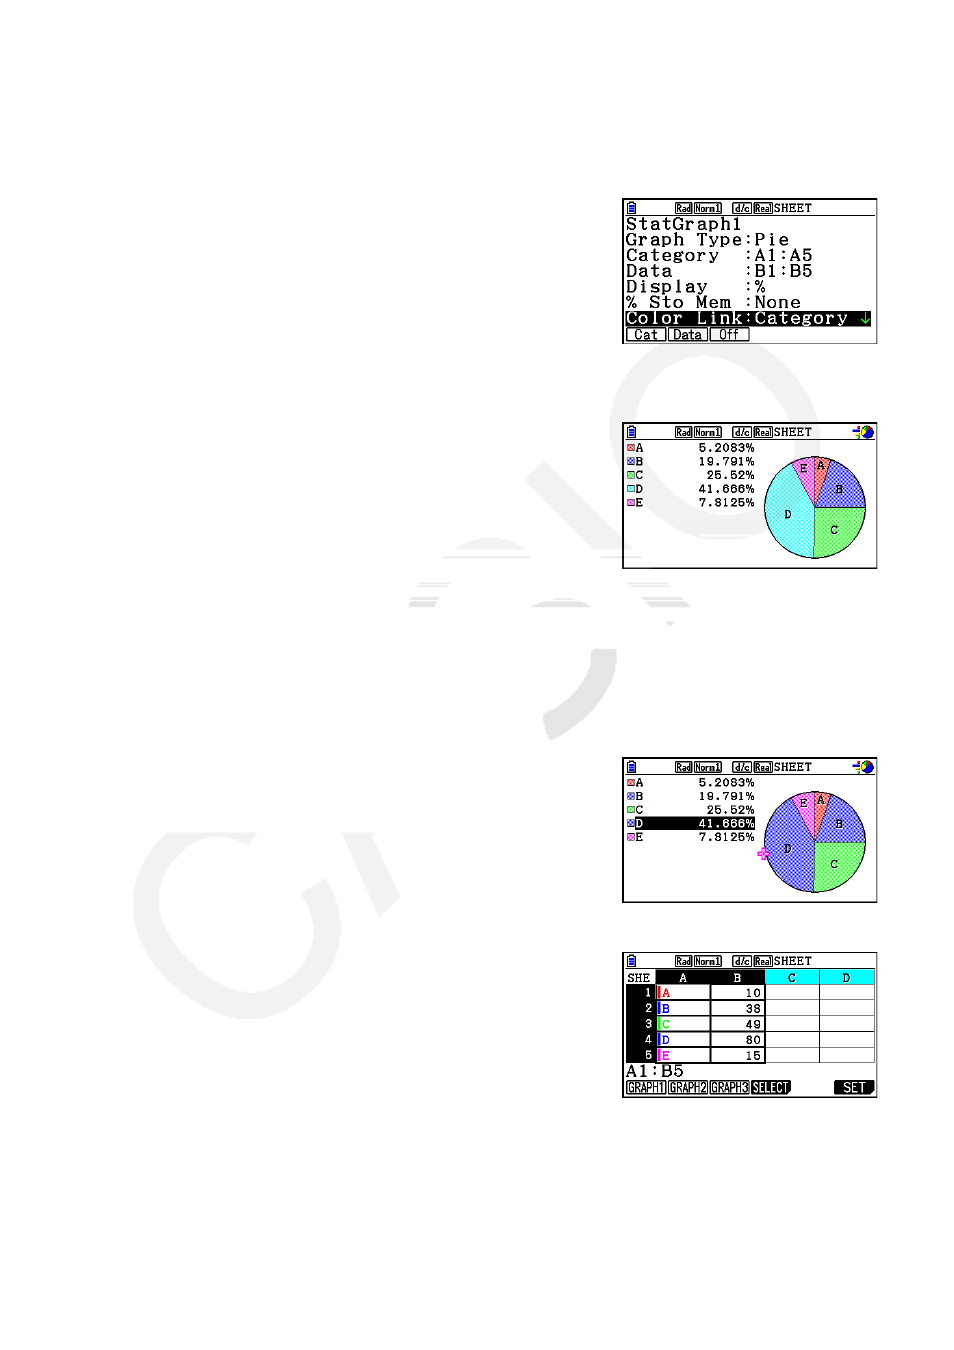
3. Perform the following operation to display the general graph settings screen:
6(g)
1(GRAPH)6(SET).
• The “Category” and “Data” settings are configured automatically. Check to make sure that
A1:A5 is shown for “Category” and B1:B5 is shown for “Data”.
4. Use
f and c to move the highlighting to “Graph Type” and then press 4(Pie).
5. Use
f and c to move the highlighting to “Color Link”
and then press
1(Cat).
6. Press
J to exit the general graph settings screen.
7. Press
1(GRAPH1).
• The graph will reflect the text colors in the “Category”
cell range (A1:A5).
• This completes graphing with Color Link. Next, let’s change the colors on the graph
screen.
8. Press
!1(TRACE).
• This will highlight label A and display a pointer in area A of the graph.
9. Use
f and c to move the pointer to area D and then pres !f(FORMAT).
10. On the color selection dialog box that appears, press c(Blue).
• This will close the dialog box and change the color of
area D to blue.
11. Press
J to close the graph screen.
• The color you change to on the graph screen will be
reflected as the text color in the applicable cell of the
“Category” cell range.
