K graph draw/non-draw status, K statistical graph v-window settings – Casio FX-CG10 User Manual
Page 200
6-7
• D1 Area, D2 Area, D3 Area (Specifies the fill colors of bar graphs Data 1, Data 2, and
Data 3.)
Settings are the same as those for Hist Area.
• D1 Border, D2 Border, D3 Border (Specifies the border colors of bar graphs Data 1,
Data 2, and Data 3.)
Settings are the same as those for Hist Border.
k Graph Draw/Non-draw Status
[GRAPH]-[SELECT]
The following procedure can be used to specify the draw (On)/non-draw (Off) status of each of
the graphs in the graph menu.
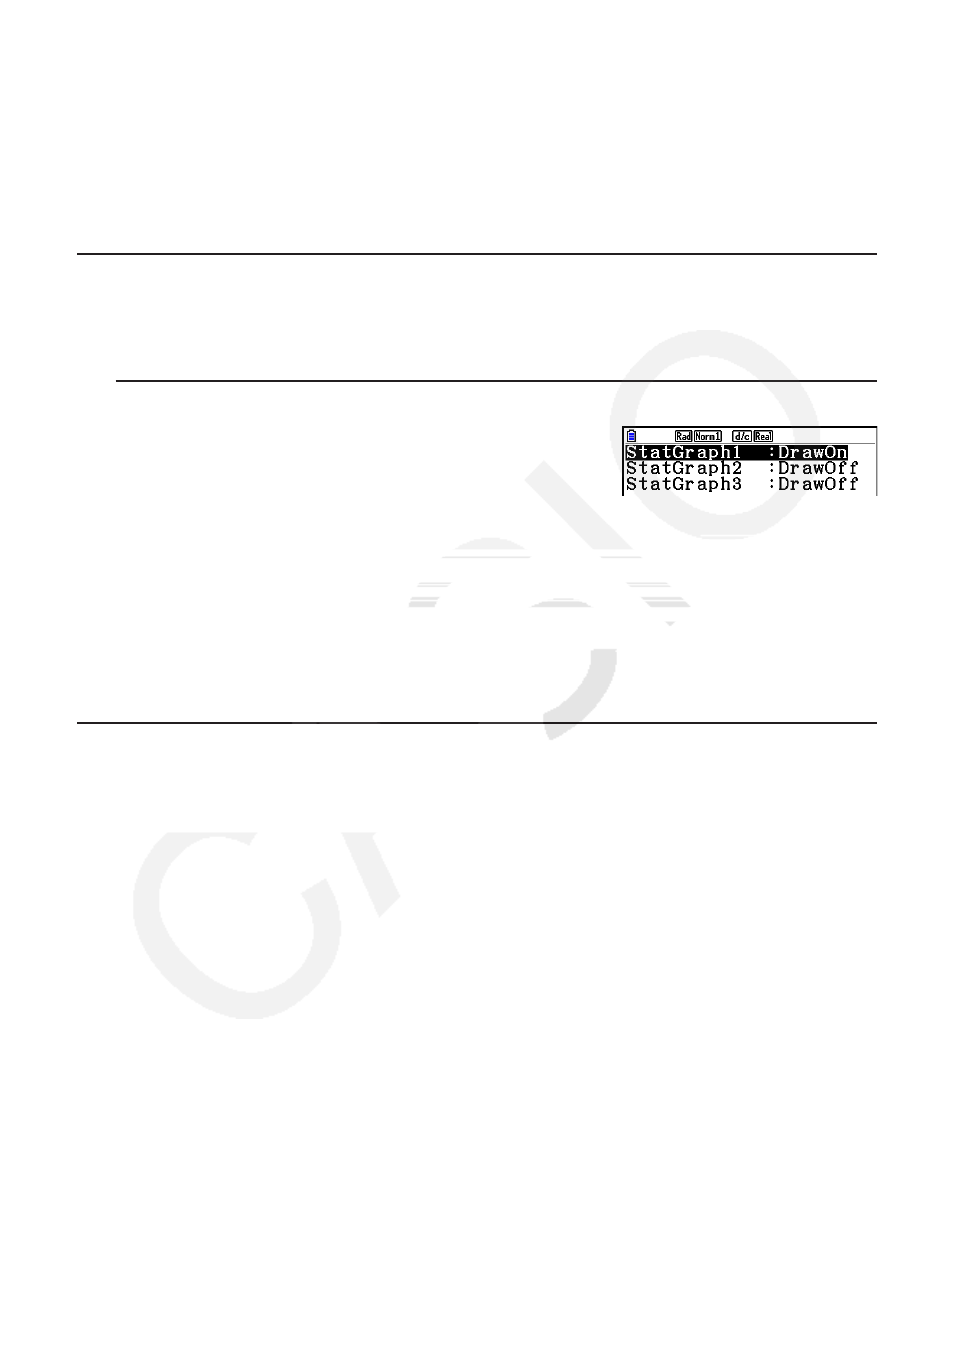
u To specify the draw/non-draw status of a graph
1. Pressing
1(GRAPH) 4(SELECT) displays the graph
On/Off screen.
• Note that the StatGraph1 setting is for Graph 1 (GRAPH1 of the graph menu), StatGraph2
is for Graph 2, and StatGraph3 is for Graph 3.
2. Use the cursor keys to move the highlighting to the graph whose status you want to change,
and press the applicable function key to change the status.
• { On } / { Off } ... {On (draw)}/{Off (non-draw)}
• { DRAW } ... {draws all On graphs}
3. To return to the graph menu, press
J.
k Statistical Graph V-Window Settings
V-Window parameters are normally set automatically for statistical graphing. If you want to set
V-Window parameters manually, you must change the Stat Wind item to “Manual”.
While the List Editor is on the display, perform the following procedure.
!m(SET UP) 2(Manual)
J(Returns to previous menu.)
Note that V-Window parameters are set automatically for the following types of graphs
regardless of whether or not the Stat Wind item is set to “Manual”.
Pie, 1-Sample
Z
Test, 2-Sample
Z
Test, 1-Prop
Z
Test, 2-Prop
Z
Test, 1-Sample
t
Test, 2-
Sample
t
Test,
χ
2
GOF Test,
χ
2
2-way Test, 2-Sample
F
Test (
x
-axis only disregarded).