K general graph settings screen operations – Casio FX-CG10 User Manual
Page 379
9-28
k General Graph Settings Screen Operations
You can use the general graph setting screen to specify the range of data to be used for
graphing, and to select the type of graph to be drawn.
u To configure statistical graph settings
1. Input the statistical calculation data into the spreadsheet and then select the range of cells
you want to graph.
• Actually, the above step is not necessary at this point. You also could configure settings
first before inputting data and selecting the range of cells to be graphed.
2. Press
6( g) 1(GRAPH) 6(SET).
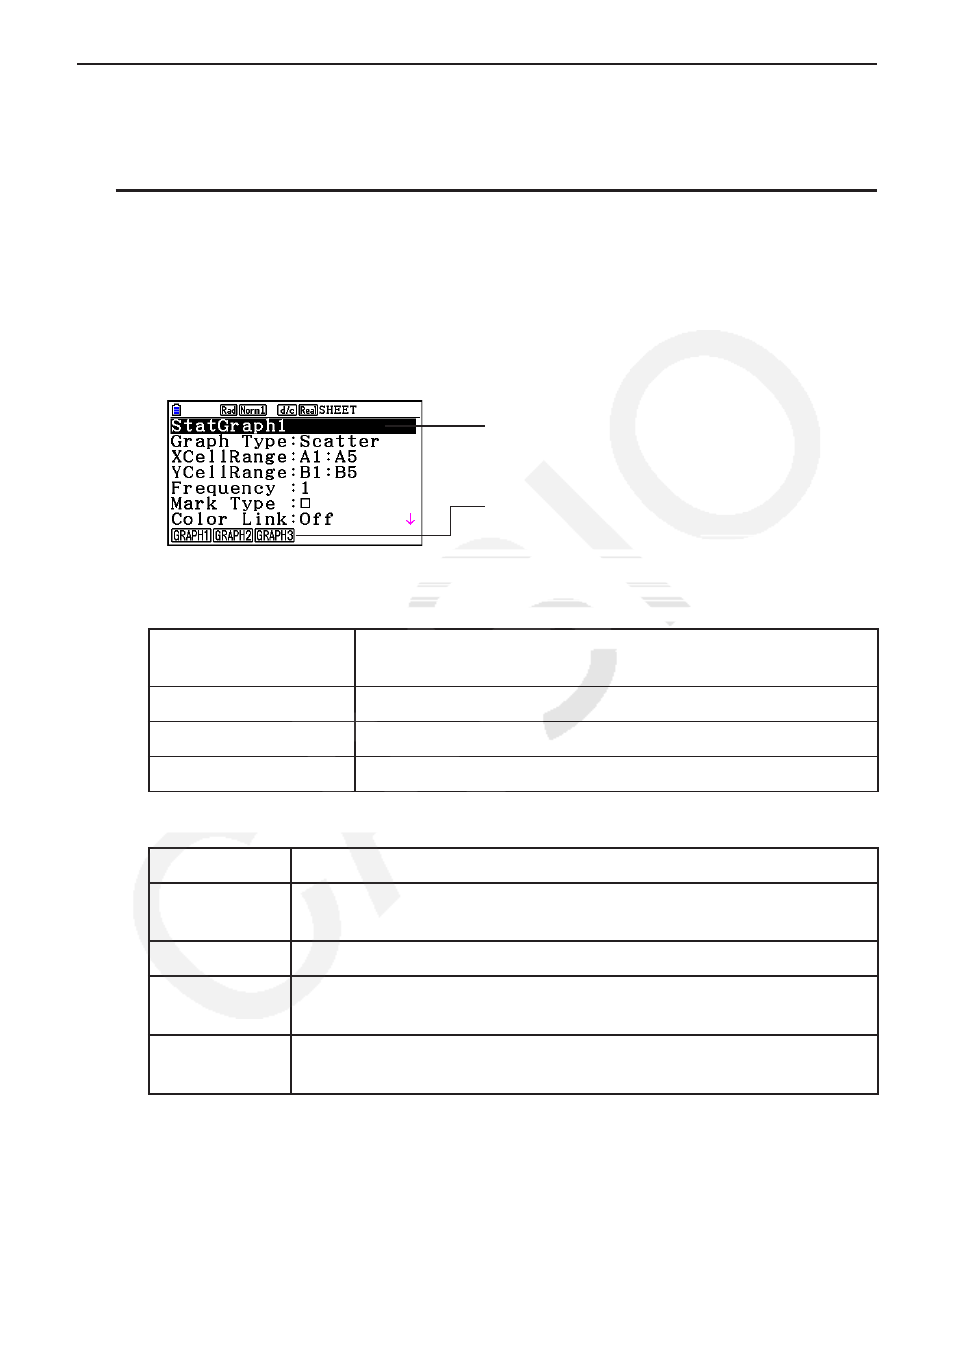
• This will display the general graph settings screen (StatGraph1 in this example).
You can configure the setting for the item that is
highlighted on the screen.
A function menu will appear when certain
setting items are selected.
• The number of columns you select in step 1 will determine what information is input
automatically on the general graph settings screen.
If you select this
number of columns:
This information will be input automatically:
1
XCellRange
2
XCellRange, YCellRange
3
XCellRange, YCellRange, Frequency
• The following describes each of the setting items for this screen.
Item
Description
StatGraph1
Select the name of the setup you want. You can have up to three
different setups registered, named StatGraph 1, 2, or 3.
Graph Type
Select the graph type. The initial default setting is Scatter (scatter plot).
XCellRange
Specifies the cell range assigned to the graph
x
-axis (XCellRange).
Only XCellRange is displayed for some Graph Types.
YCellRange
Specifies the cell range assigned to the graph
y
-axis (YCellRange).
The YCellRange is not displayed for some Graph Types.