Dynojet WinPEP 7 User Manual
Page 67
G R A P H I N G A R U N
Graphing a Run
Version 2
WinPEP 7 User Guide
5-3
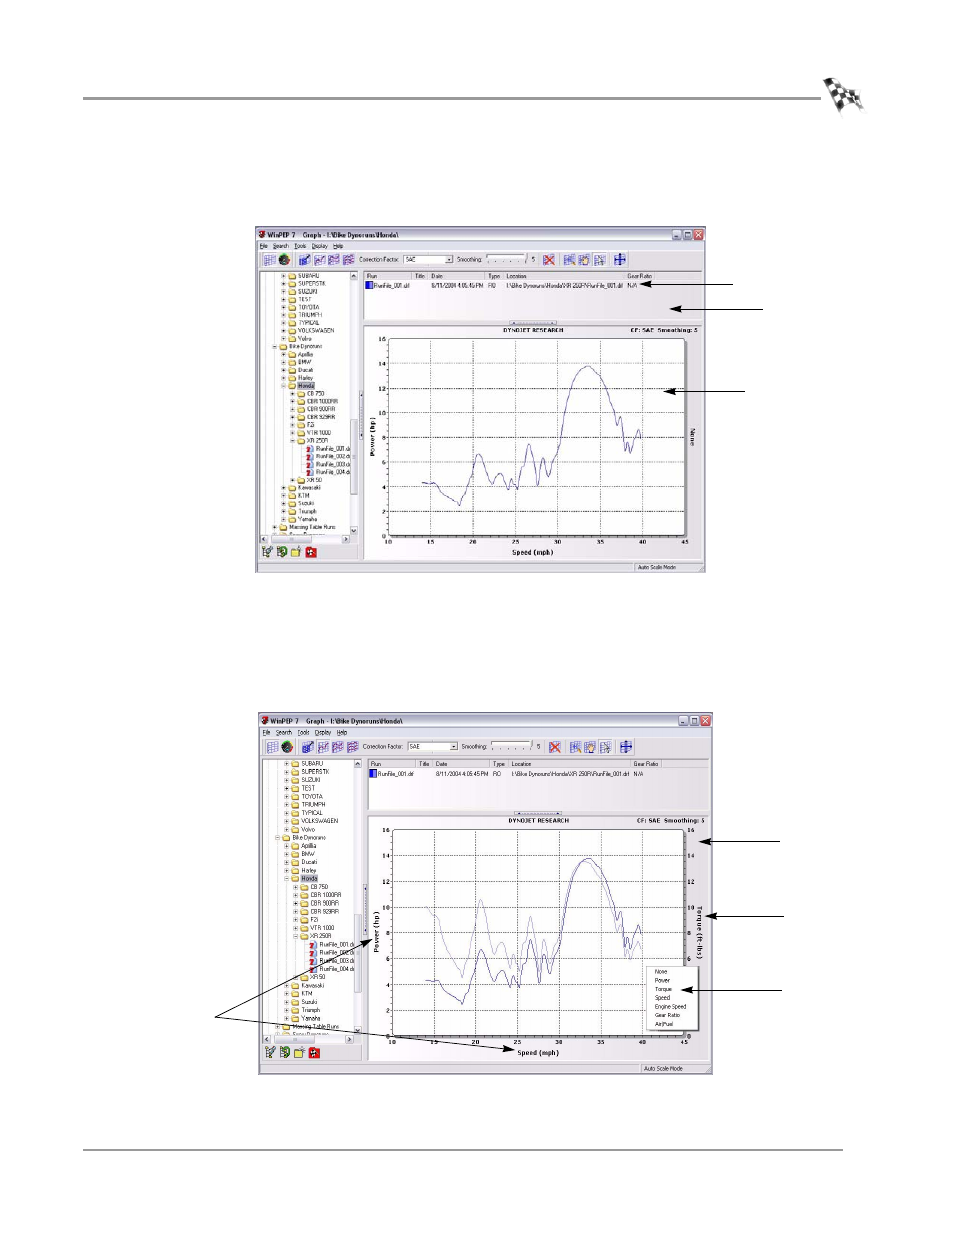
The run information is displayed in the ListView along with a graph of the run.
Note: Up to twelve runs can be displayed.
Figure 5-2: Graph Screen—Run Loaded
Once the run is graphed, you can configure the graph using the axis selection
buttons. As you move your cursor over the axis channel label, the axis selection
button will appear.
5
Click on any of the three axis channel labels and choose an option from the list.
Figure 5-3: Graph Screen—Axis Channels
run information
graphed run
list view
axis channel labels
axis channel
label
axis channel
options
axis selection
button
This manual is related to the following products: