Dynojet WinPEP 7 User Manual
Page 39
G E T T I N G S T A R T E D W I T H W I N P E P 7
Exploring the Graph Toolbar
Version 2
WinPEP 7 User Guide
3-5
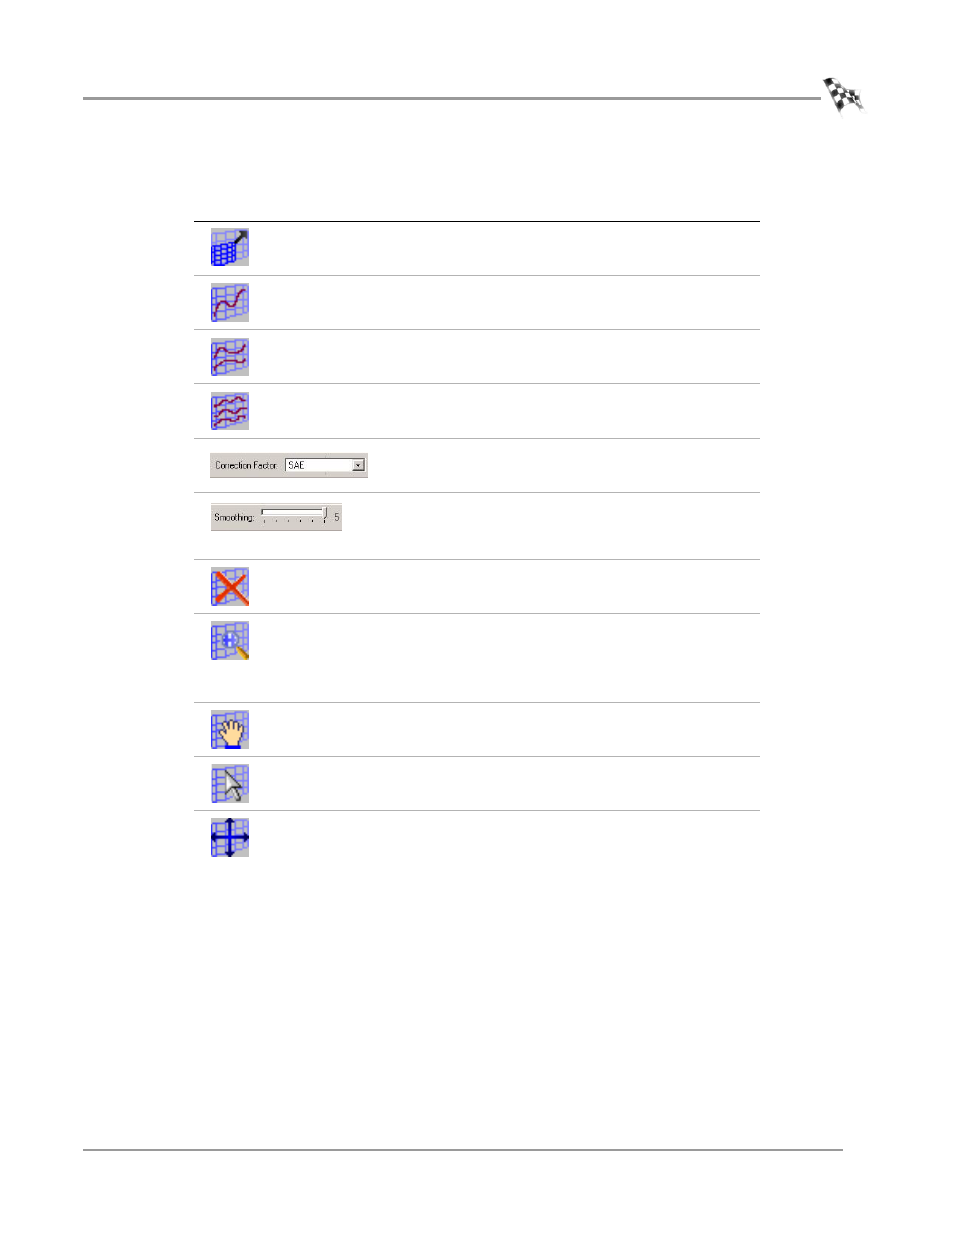
A description of the toolbar buttons and functions follows.
press this button
to
Fill the entire window with the graph.
Display the graph with two vertical axes (normal).
Display the graph with four vertical axes.
Display the graph with six vertical axes.
The correction factor changes the view of the graph
using either
, or Uncorrected
correction factors.
Smoothing lets you to show six different levels of
detail in the graph. Level zero shows the most detail
while level five shows the least detail. Level three is
the default setting.
Remove all currently graphed runs displayed in the
ListView.
Change the magnification level in the graph display.
Clicking and dragging on the graph selects a zoom
box.
Clicking and dragging on any axis zooms in and out
on that axis only.
Move the graph around inside the window.
Move the vertical cursor or select runs (do not pan or
zoom).
Restore the graph to default scaling.