Root cause analysis – Rockwell Automation FactoryTalk Report Expert User Guide User Manual
Page 64
Chapter 5 Understanding Report Templates
64
Rockwell Automation Publication RPTEXP-UM001H-EN-P-June 2014
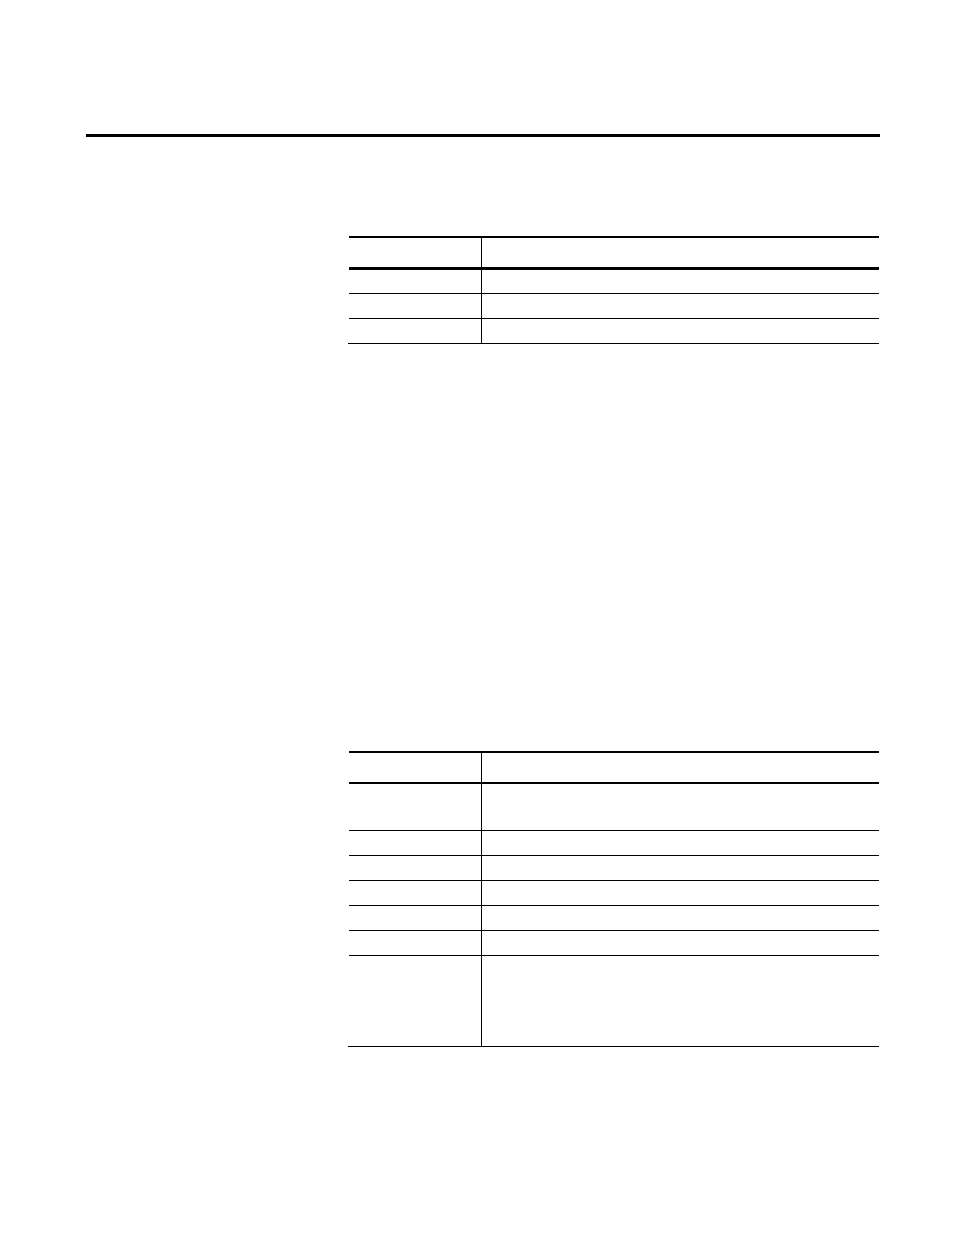
The bar chart fields:
Item
Description
Value
Quality %
X axis grouping
First non-page grouping parameter
Series
Second non-page grouping
Calculations used by Report Expert to obtain values in the resulting
report:
• Quality = GoodParts / TotalParts
The Root Cause Analysis report template consists of a Gantt chart
displaying work cell state occurrences over time. The chart will
display the work cells in the order specified in the Line Order (page
164) tab. Below the Gantt chart for each line is a table of data
showing the same data used in the chart.
Query: State Detail.
The fields of the report template grid:
Item
Description
Work Cell
A level of the plant model (which is constructed by enterprise, site,
area, line, and then work cell).
Shift
The shift during which the data was collected.
Shift Start
The start time of the shift during which the data was collected.
State Name
The machine state. This field is color coded.
Start Time
The date and time that the event or state started.
End Time
The date and time that the event or state ended.
Duration
The length of the event, calculated as the difference between start
time and end time and displayed using the format
HH:MM:SS.mmm. The calculation for this field is:
Duration = End Time - Start Time.
The maximum number of rows in the resulting report: 1000.
Root Cause Analysis